- March 23, 2023
- Posted by: Shane Daly
- Categories: Stock Trading, Trading Article

Are you looking for the best stock exit strategy? It can be difficult to determine when it’s time to take profits or cut losses in a trade. Knowing which exit indicator is most reliable and what strategies are the safest way out of your positions is critical for successful trading.
In this blog post, we’ll cover why an exit strategy is important, 4 effective methods you can use, the best exit indicator to look out for and when it’s time to make your move on exiting stocks.
What You Will Learn:
What is an Exit Strategy?
An exit strategy is a plan for exiting a stock trade. It outlines when to sell and how much profit or loss you are willing to accept. Having an exit strategy in place before entering a trade helps you manage risk and maximize profits.
A good exit strategy should be tailored specifically for each trader, as everyone has different goals and objectives when trading stocks.
For example, some traders may want to hold onto their stocks until they reach a certain profit target while others prefer taking profits as price continues to move in their direction. Knowing your personal preferences will help you determine which type of exit strategy works best for you.
Another key component of an effective exit strategy is setting stop-loss orders. Stop-loss orders allow traders to automatically close out positions if price reaches a certain price level, helping to avoid large losses on trades that don’t go according to plan. This can be especially useful during volatile markets where prices can move quickly in either direction without warning.
Keeping track of all your trades with detailed notes on entry points exits points and reasons why you chose to exit, will help ensure consistency in future trades. Reviewing your notes can show if you are using objective measures or letting emotions dictate your trading.
Why Is An Exit Strategy Important?
It helps you make decisions about when to get out of a trade, based on your risk tolerance, your goals, and your trading strategy. Without an exit strategy, you may be tempted to hold onto losing trades too long or take profits too early when in a winning position.
Having an exit strategy in place can help traders stay disciplined and stick to their trading plan. It also helps avoid emotional decision-making that could lead to costly mistakes. For example, if the market moves against your position, having an exit strategy for losing trades will prevent the “hope and pray” method of trading. If price hits your exit, you are out.
Know your time horizon. Day traders may use more frequent exits than swing traders as market volatility may pick up and you have multiple day trades in the session. Swing traders tend to hold trades longer than a day but they will also use stock exit strategies to manage their trades.
4 Exit Strategies To Use For Trade Exits
Stop-Loss Orders
Stop-loss orders are a type of exit strategy that allows traders to set an order at a specific price level. This is done to limit the losses that may incur if the market moves against them. When price breaks this predetermined price, the trade will be closed.
For example, if you have bought a stock for $50 and set your stop-loss order at $45, then when the stock drops to $45 it will automatically be closed and you won’t lose more than 5 dollars per share.
Trailing Stops
Trailing stops are another type of exit strategy that allows traders to lock in profits as prices move higher or lower. A trailing stop works by setting an initial stop loss below or above the current market price but not profit targets. If price falls to the target price, the trade is closed.
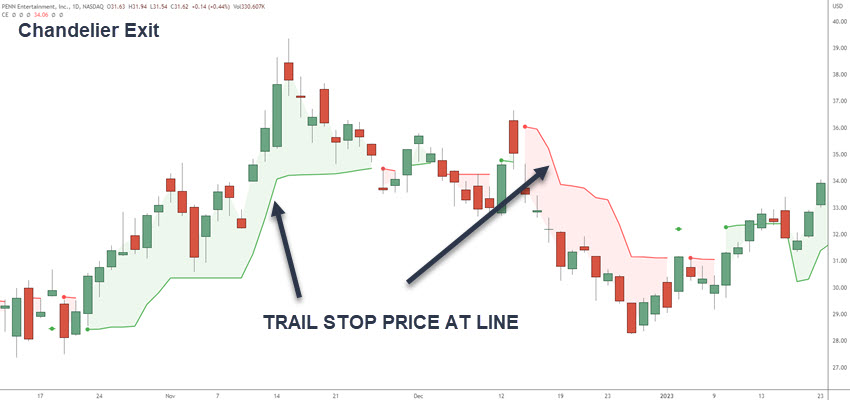 As prices move up or down, so does your stop loss; allowing you to capture gains while limiting losses should prices start moving against you. Traders can use X number of bars previous or the Chandelier Exit indicator.
Time-Based Exits
Time-based exits involve setting an expiration date on trades rather than relying on technical indicators such as moving averages or other chart patterns for exits. By utilizing this approach, traders can avoid getting stuck in positions due to fear or greed. From experience, traders start to take profits 3-5 days into a trade which is the usual time before price moves against the position, albeit sometimes briefly.
Volatility-Based Exits
Volatility-based exits involve monitoring changes in volatility levels within markets before exiting positions. Generally, high volatility indicates high risk so it is usually best to close out positions during periods of increased volatility since there is a greater chance price will move against you.
On the flip side, low volatility is often associated with calmer markets where one is less likely to experience large swings in either direction making it an ideal environment to stay in the position for longer periods.
Best Exit Indicator To Use
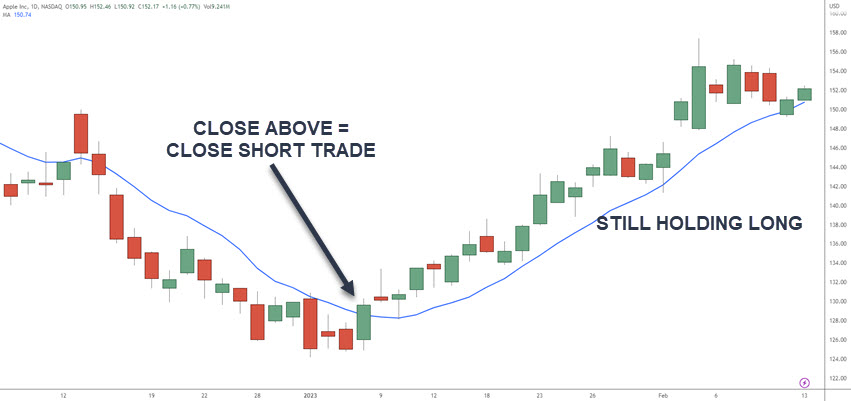
Moving averages are a popular choice, as they provide an easy way to not only identify long term trends in price action but also shorter-term momentum shifts. Using a 10 period simple moving average let’s you ride the momentum and allow gains to add up. Once price closes above/below the average, you’d exit the trade.
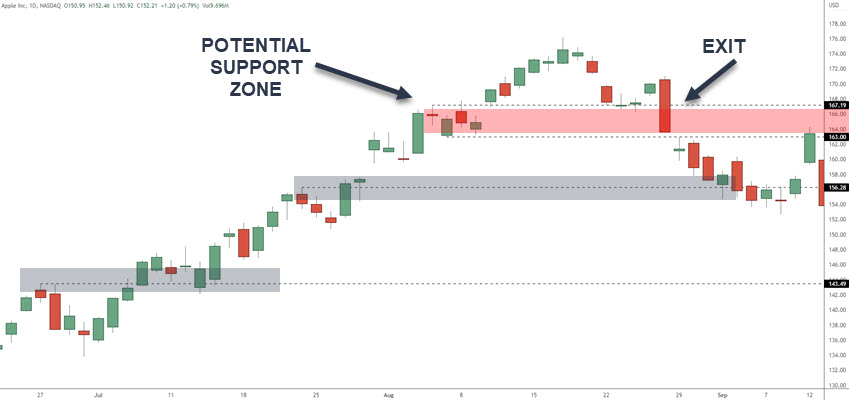
 Support/resistance levels can also be used as indicators of when to exit a position. If prices break through these levels, it could signal that the trend has reversed and it’s time to close out your position.
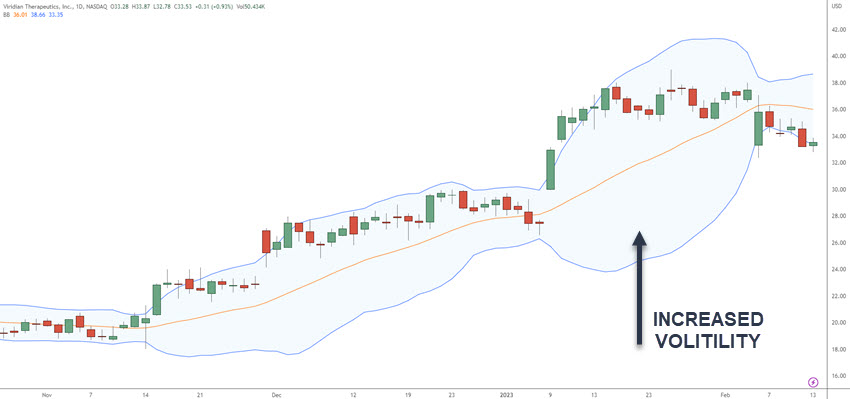
 Bollinger Bands are another popular tool for traders looking for an indication of when to exit their positions. These bands consist of two lines plotted two standard deviations away from a simple moving average (SMA). When prices move outside these boundaries OR the bands “balloon”, it can indicate that price is overextended and looking to move against the main direction.
Using Keltner Channels and looking for moves outside the bands, can give you an indicator of increased volatility.
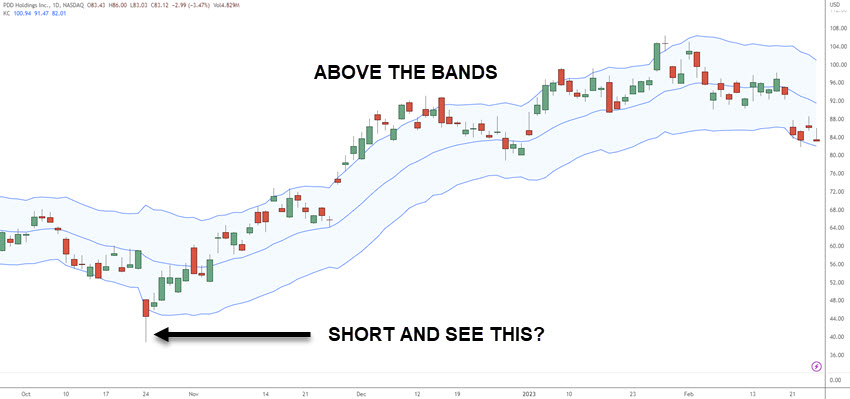
Reversal candlesticks through the high or low of the band is a sign to take profits or tighten stops. Price above the bands may have you tightening the stop loss closer to current price.
Finally, MACD (Moving Average Convergence Divergence) is one more technical indicator that some traders use as an exit strategy indicator due to its ability to detect changes in momentum quickly.
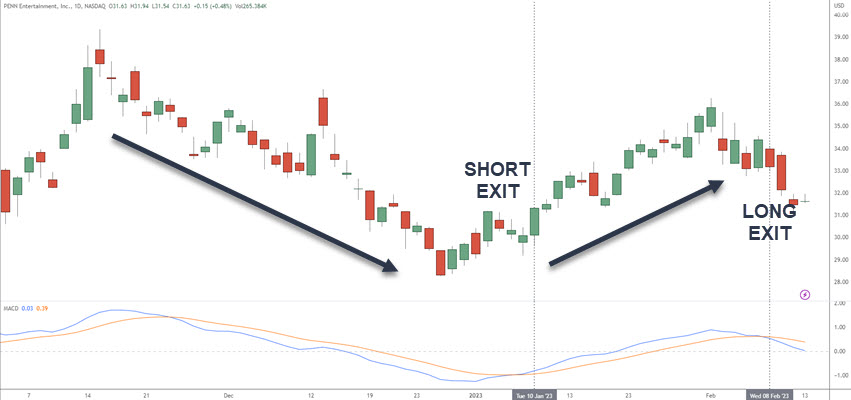 When MACD crosses below zero this indicates bearishness while crossing above zero indicates bullishness – both potentially signaling times when you should consider closing out your positions accordingly. For a quicker exit, look for a crossing of the fast line and the slow line.
When is the Best Time to Exit?
If a trader has set a goal of making 10% profit on their trades for example, they may decide to exit when that goal is reached or exceeded. If a trader has a low-risk tolerance and wants to minimize losses as much as possible, they may choose to exit at any point where prices begin falling significantly.
Some traders will use multiples of the reward risk ratios. This means a trader would look to close a trade at one to three or four times their initial risk on the trade (3R)
Market conditions can also play an important role in determining when it’s best to exit from a trade. If market conditions are favorable for stocks or options at the time of entry into the trade, then traders may want to consider taking profits if the price movement becomes choppy.
Timing is also a key factor when it comes to deciding the best time for traders to exit from trades. Some may choose to enter into trades just prior to or during earnings season to capitalize on potential price swings due to announcements related to news releases; however, once this period ends they should have an exit strategy ready as prices could quickly return to the entry point after reaching their peak following the earnings report.
What Is The Best Exit Indicator For Stocks?
The best stock exit indicator is one that you will use in a consist manner. Indicators such as moving averages, relative strength index (RSI), and stochastics can help identify potential entry and exit points in the market as well as keep a trader objective. Using risk reward ratios, trailing stops, or exiting after X amount of days, are all viable approaches to exits.
Conclusion
Knowing when to get out of a position can be the difference between success and failure in the market. There are several strategies you can use, such as trailing stops, time-based exits, or target prices. You should also consider what indicator will give you the best signal for exiting your trades.
Timing is key – understanding when to make your move can help ensure that you get the most out of each trade and maximize your profits with a good stock exit strategy. Whether day trading ,swing trading, or position trading, having an exit strategy for both profit and losses is vital to trading success.
1 Comment
Comments are closed.
Do you have a exit strategy for short call credit spreads and short put credit spreads and how to monitor both on TOS platform