- December 17, 2021
- Posted by: Shane Daly
- Category: Trading Article
You recently were shown several charts in a blog post called: The Truth About Big Price Moves.
Big price moves are often the catalyst for having a trader take risks on the next move due to the fear of missing out. In the article, I pointed out that a trader is not always responsible for the first big move in price.
Often times, big moves can come out of nowhere.
When you do see a large move, something has changed. Whether that will equal another large move is unknown. But that large move has put you on alert and if you miss the next move, that is on you.
I want to go over the charts that were presented with the hopes that:
- You understand you need to be clear on how you trade (F)
- You accept that even great patterns can fail (ABNB)
- You see that often times, the bigger picture can alert you to market trading conditions (ES)
All of what you are about to read and the approaches mentioned, have been talked about in many of our blog posts.
None of what you will read is made up “on the fly” to suit the chart.
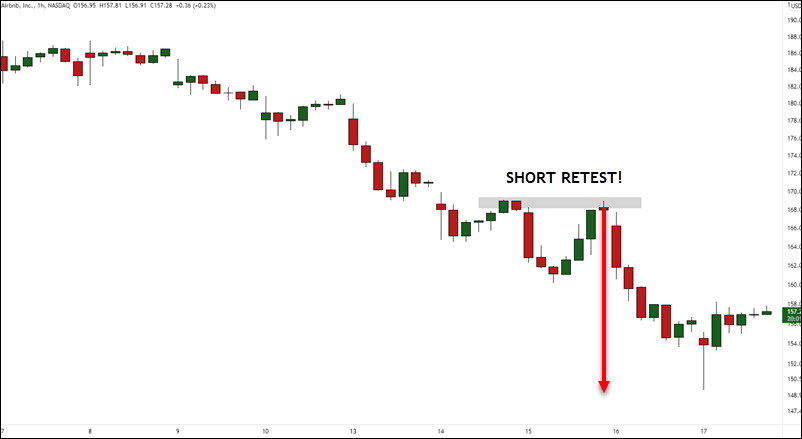
ABNB
This stock had a large move out of a pullback and was setting up a potential bull flag. Keep in mind that overall, the market is still bullish and on charts such as the daily and weekly, buys are a usually a safer bet.
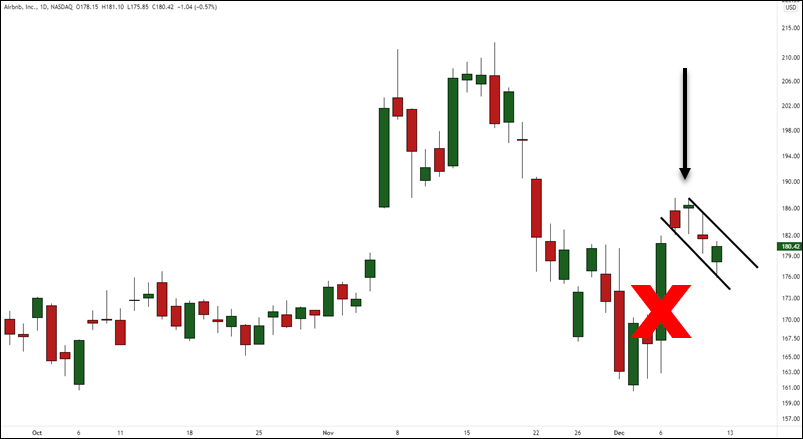
In the article, I mentioned that I did not want to see momentum come into the flag to the downside. If I did, a long trade was off the table.
The day after the chart was posted, momentum stepped into the stock to the downside.
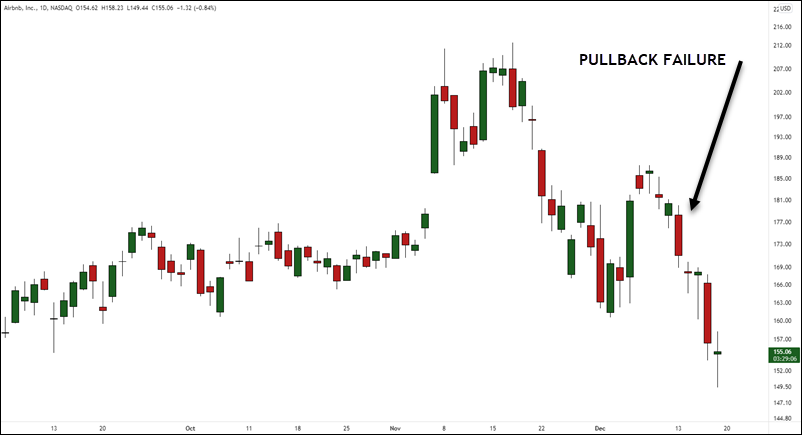
There are generally two ways a pullback will fail:
- Price will begin to form a trading range
- Momentum push in the direction of the pullback
Not something I would be interested in buying now and we could see a 133-135 price tag for this stock. Shorter time frame traders may look to buy bounces but a daily chart trader, this is off the radar at this time.
For me, my plan would need to see price holding some level of price support before looking for a buy.
ORCL
Oracle stock had a large gap up of almost 20%.
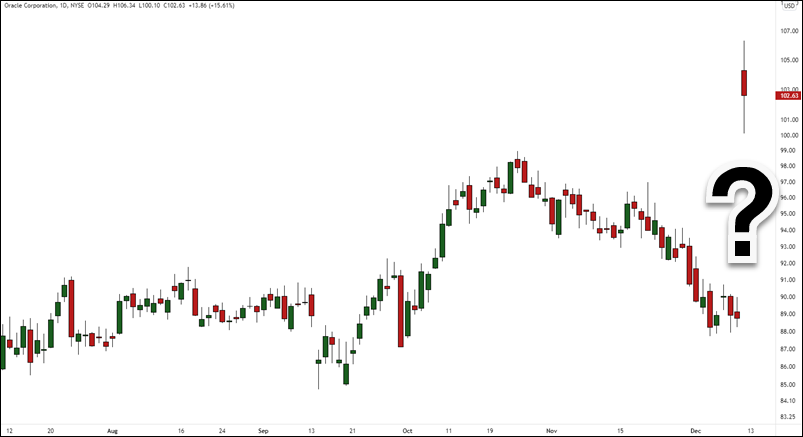
I mentioned that if you were a trader that looks at gap fills, you are responsible for the next move. There was no price action signal that this gap up was to be expected.
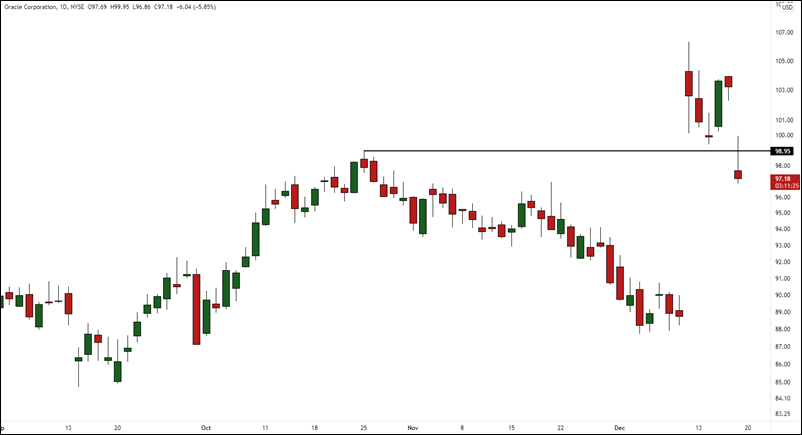
How you trade a potential gap fill will be different than another trader. The key point here is that there was a reversal off the gap up and this is the move you’d be responsible to trade.
If you missed it and this is your strategy, then you did not do your job. Sticking to your trading plan is the most vital thing a trader can do.
ES Futures
Price had pushed higher and was consolidating at a price zone acting as resistance and is generally bullish. If you “missed” the first move up, you were looking for a push up from this zone.
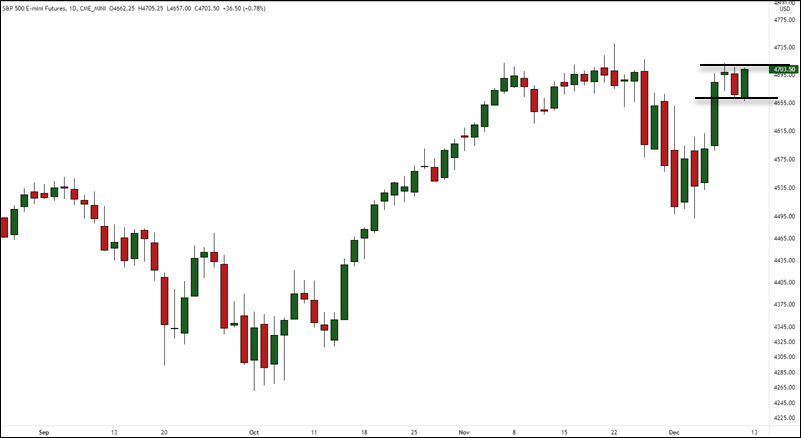
What was a clean looking consolidation turned ugly as the days went on. This is a great example as to why a trader must be clear on:
- Setups
- Entry triggers
- Protective stop locations
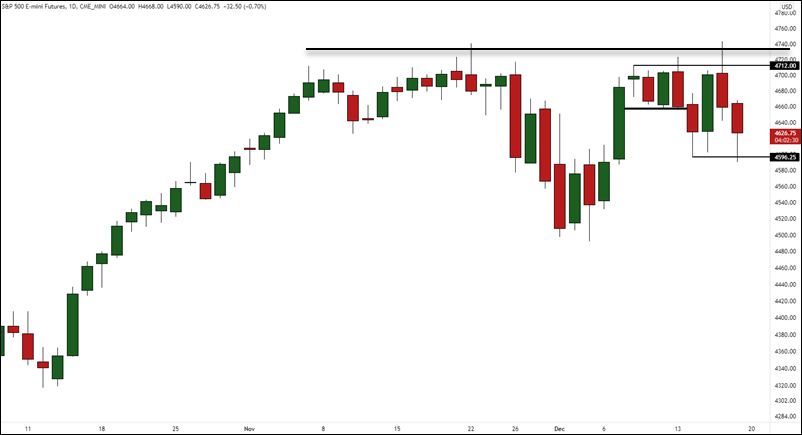
Price didn’t post a strong close in either direction but no doubt took out both long and short traders.
How do you know?
A pattern called a megaphone/broadening formation/expanding range has formed. The label of the pattern is irrelevant if you understand the price action that is taking place.

This pattern on a higher time frame such as the inset monthly chart, would show this as an outside bar.
By looking at the hourly chart, we can see how this played out in better detail:
- Price made a higher high and higher low and and higher high which is bullish
- Price then drops through the HL (higher low) and makes a lower low taking out any long traders and enticing sellers
- We then see price take out a swing high putting in a HH (higher high) taking out the shorts and enticing longs
- We then get price breaking back down and putting in a LL (lower low)
If you flip through a universe of stocks, you will see that this past week, trading would have been difficult if on slightly higher time frames.
F
Ford is not the most exciting chart to trade and we recently had a consolidation and upside breakout take place. The point of this chart was that unless you trade the actual breakout or positioned at the low of a trading range, you’d not be in this trade.
But you would not have missed it if you trade breakouts by looking for a pullback or consolidation.
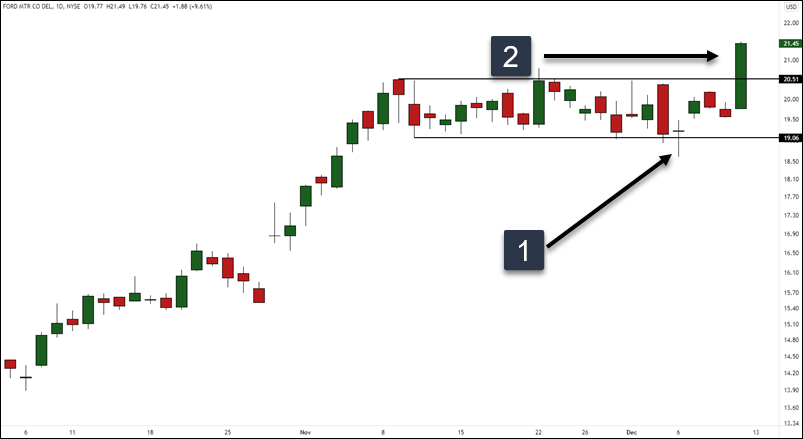
This bullish move of Ford was short-lived.
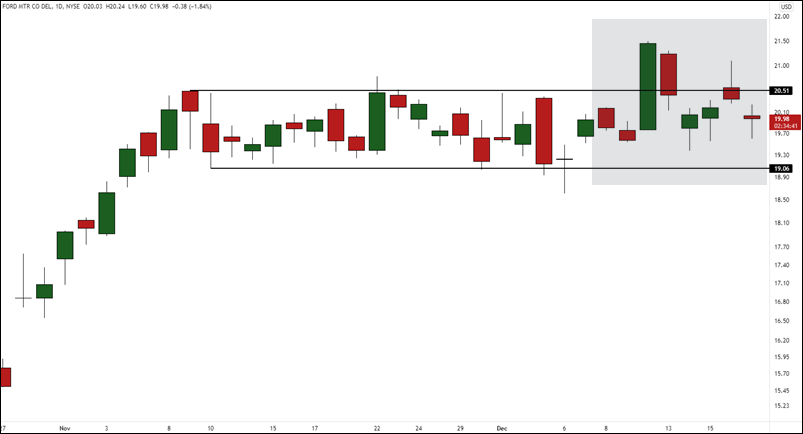
Price has failed to hold above the breakout level. Some will call this a failed breakout but in fact price did break out.
It just failed to hold the level. I call it a breakout failure and while some will accuse me of mincing words, I prefer to be a bit more precise.
A trader that uses breakout/pullbacks to enter these is having no FOMO on the next move. Their plan is no longer valid the moment price was holding acceptance inside the range. The reversal red candle should have had a trader tossing in the towel with this ticker on their watchlist, for now anyways.
Conclusion
It would have been easy to change the channel and say we took the short on ABNB. We would have looked genius.
After all, many sites do exactly that.
But that wouldn’t help you.
I could have used a lower time frame from the original chart and found an entry short.
 But that would not be my approach to swing trading. I will use a lower time frame for an entry trigger into a higher time frame setup.
Good Chart Selections
This was a good selection showing pattern failures, successes, and how the market can move to stop out both long and shorts quite easily.
I hope you have realized that you need a trading plan and an approach that fits you. Nothing can be left to chance and while my approach does have discretion, there are enough rules that keep me from doing stupid things.
Is it perfect? No.
But I can say that FOMO and the impulse to do things that can demolish my account, don’t really happen.
I hope you all can feel the same way.