- December 17, 2024
- Posted by: Shane Daly
- Categories: Day Trading, Trading Article, Trading Indicators
If you’ve been struggling to time your day trading entries and exits, Bollinger Bands might be the tool you’ve been looking for. This dynamic indicator adapts to market volatility, helping you spot potential breakouts and reversals before they happen. Combining the bands’ visual signals with volume analysis can transform your trading approach, but there’s more to mastering this versatile indicator than meets the eye. Understanding the subtleties of band compression, expansion, and trend recognition will put you ahead of traders who take a more basic approach.
TLDR
- Bollinger Bands Basics: Bollinger Bands consist of a middle band (20-day SMA) and two outer bands (two standard deviations above and below). They dynamically adjust to market volatility, expanding during high volatility and contracting during low volatility, making them a versatile tool for identifying potential breakouts and reversals.
- Key Strategies: Effective strategies include the “squeeze” (narrow bands signaling potential breakouts), mean reversion trades (buying at the lower band and selling at the upper band), and trend-following (prices “walking” the bands during strong trends). Combining Bollinger Bands with indicators like RSI or MACD enhances accuracy.
- Volatility Insights: Bollinger Bands are a reliable indicator of market volatility. Wider bands indicate high volatility, while narrower bands suggest low volatility. Band squeezes often precede significant price movements, making them critical for spotting trading opportunities.
- Customization for Better Results: The standard settings (20-period SMA, 2 standard deviations) are effective but can be adjusted based on trading style and market conditions. Shorter periods are better for day trading, while longer periods suit broader trends. Adjusting settings for volatility helps optimize performance.
- Common Mistakes to Avoid: Avoid relying solely on Bollinger Bands without confirming signals with other indicators. Be cautious of false breakouts, and always use proper risk management techniques, such as stop-losses and position sizing, to mitigate potential losses.
What Are Bollinger Bands and Their Function?
Three interconnected lines make up Bollinger Bands, a powerful technical analysis tool created by John Bollinger in the 1980s. When you’re looking at the basics of Bollinger Band, you’ll notice these lines consist of a middle band (20-day simple moving average but can be adjusted) and two outer bands positioned two standard deviations above and below it.

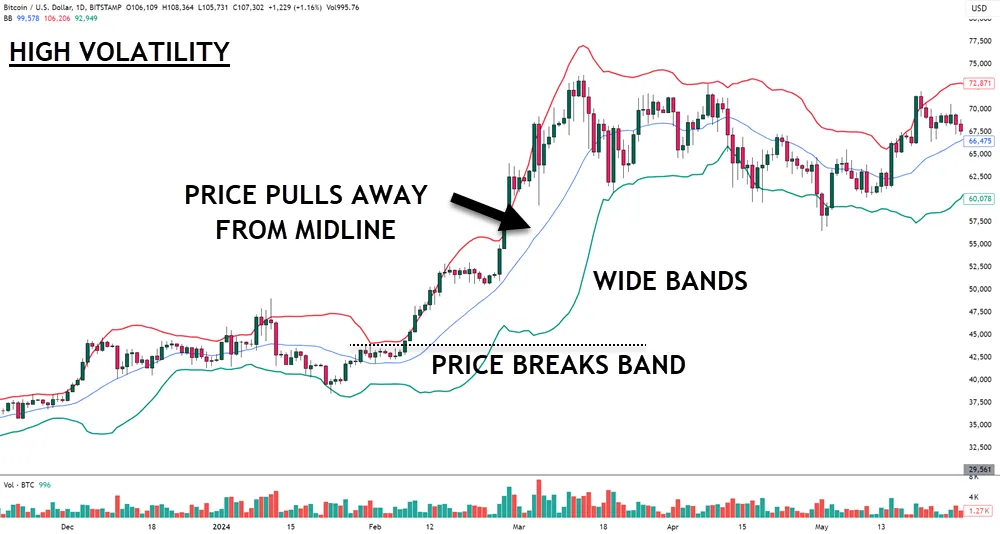
The bands expand during high volatility and contract during low volatility, creating a dynamic envelope around price movements.
You’ll find that Advanced band strategies often focus on these expansions and contractions – but have you considered how they signal potential market reversals? Bollinger Band squeezes often precede significant price movements and breakouts, making them valuable “predictive” indicators.
The Bollinger signals importance becomes clear when you see how prices interact with the bands. When prices touch the upper band, it might indicate an overbought condition; touching the lower band could signal oversold conditions.

Market conditions impact these signals, which is why you’ll want to consider:
- Volume confirmation
- Overall trend direction
- Time frame alignment
- Price action patterns
- Band width changes
These elements work together to help you identify potential trading opportunities with greater accuracy.
Using mean reversion trades can be particularly effective when price action shows double top or bottom formations near the bands.
Using Bollinger Bands for Trend Analysis Effectively
Building on your understanding of Bollinger Band basics, you’ll find these indicators particularly valuable for analyzing market trends. When you’re using one of the many Bollinger Band strategies, focus on how price movements interact with the upper and lower bands to identify potential trend reversals or continuations.
To improve the reliability of Bollinger Bands, watch for these key signals:
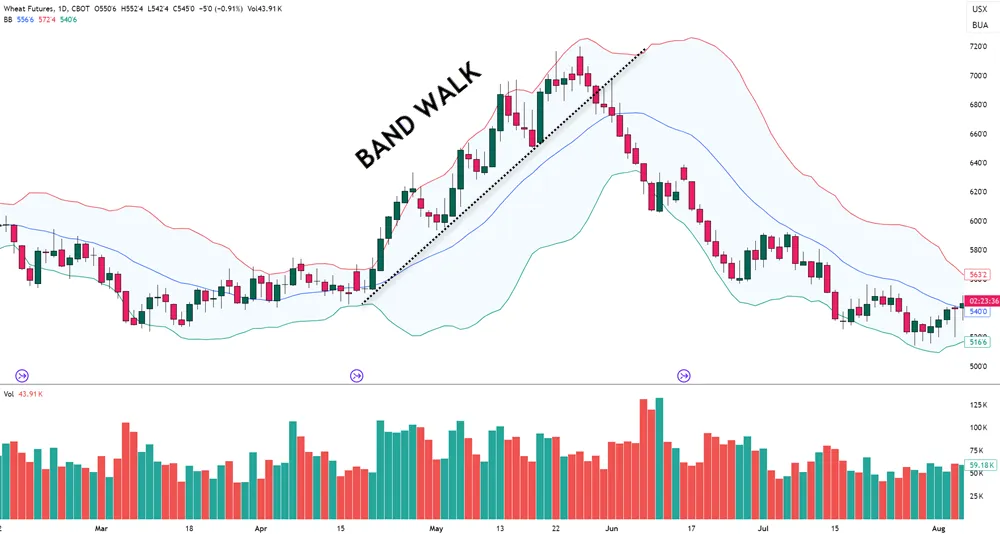
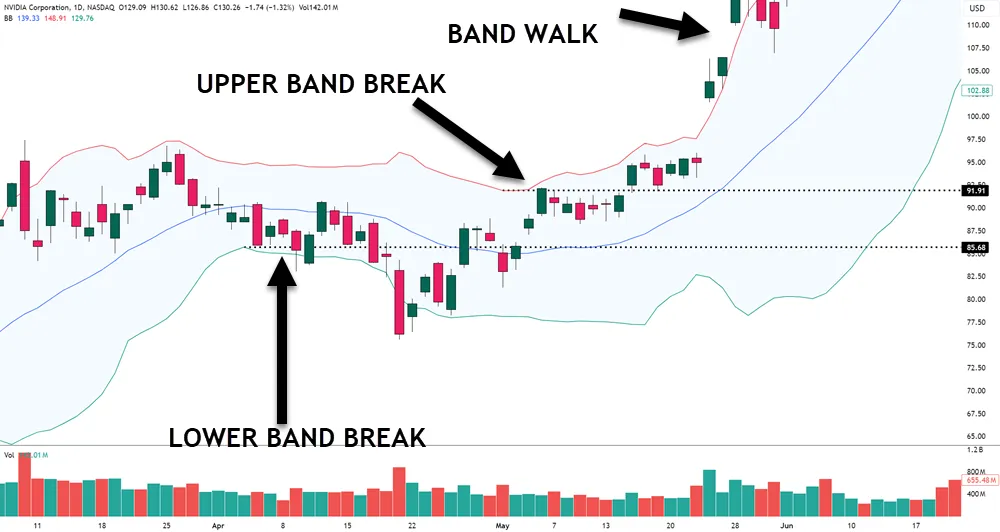
- Price “walking” along either band indicates a strong trend
- Band squeezes (narrowing) often precede significant breakouts
- Price crossing the middle band suggests potential trend changes
- Band width expansion shows increasing volatility
You can refine your Bollinger Band timing by customizing the settings to match your trading style. While the standard 20-period SMA with 2 standard deviations works well, you might adjust these parameters based on your timeframe and risk tolerance. The trailing stop orders can help secure profits as your trades move favorably in the market.
Understanding Bollinger Band psychology is important – when prices reach extreme levels, they often retreat toward the middle band. You’ll notice that markets typically spend about 90% of their time within the bands, making breakouts particularly significant.
Consider using Keltner Channels alongside Bollinger Bands to confirm potential breakout signals and improve trading accuracy.
Strategies to Enhance Day Trading with Bollinger Bands
Successful day trading with Bollinger Bands requires mastering several proven strategies that boost your market timing and risk management.
You’ll find that combining multiple approaches helps you make better trading decisions.
The squeeze strategy offers one of your most reliable setups. When you see the bands narrowing, prepare for a potential breakout.
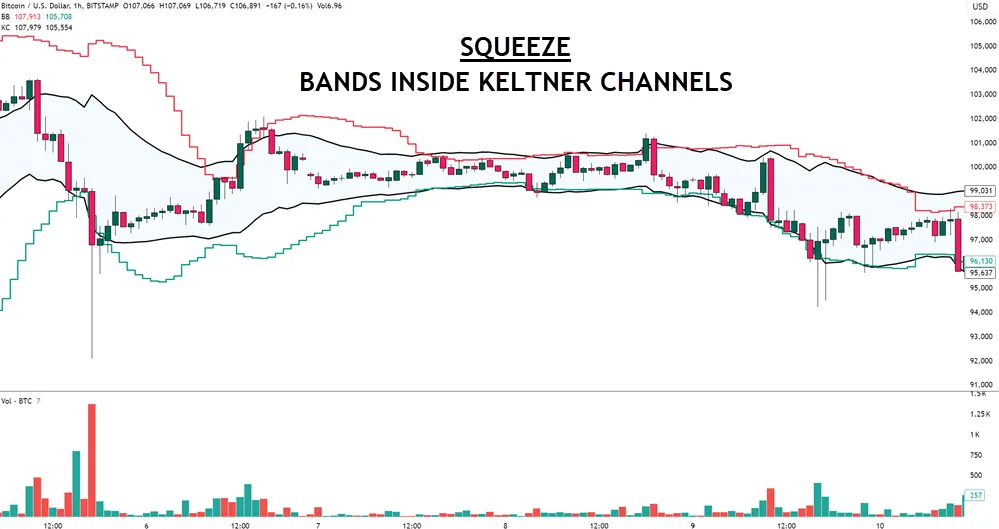
Wait for breakout confirmation through increased volume before entering your trade. For risk mitigation, place your stop-loss just beyond the opposite band.
You can also capitalize on overbought signals by selling when prices touch the upper band, or buying during oversold conditions at the lower band.
Want to improve your accuracy? Combine these signals with RSI readings for better confirmation.
Consider pairing your analysis with MACD divergence signals to eliminate low-probability trades and enhance your strategy’s reliability.
Trend following becomes more effective when you understand how prices “walk the bands.” During strong trends, you’ll notice prices staying close to either the upper or lower band.
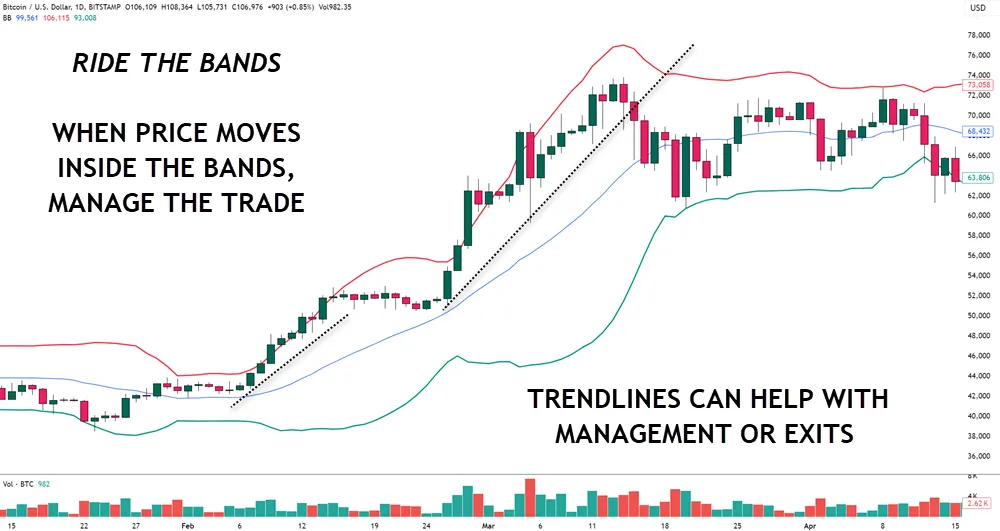
Stay in your trade as long as this pattern continues, but exit when prices cross the middle band or breaks a trendline.
Remember to validate your trades across multiple timeframes for some extra confirmation – use hourly charts for trend direction and 5-minute charts for precise entries.
Regular backtesting and refinement of your Bollinger Band strategy helps you adapt to changing market conditions.
Identifying Market Volatility with Bollinger Bands
Understanding Bollinger Band dynamics is straightforward when you focus on band width. When you see the bands expand, that’s high volatility in action – prices are making bigger swings. When they contract, you’re looking at lower volatility periods, perfect for spotting potential breakouts.
Your trading psychology factors heavily into interpreting these signals. By watching price action correlation with the bands, you’ll notice when prices touch or exceed the upper or lower bands, often indicating potential reversals.
Remember these key points:
- Wider bands = Higher volatility
- Narrower bands = Lower volatility
- Band squeezes often precede major moves
- Price movements outside bands suggest extreme conditions
For effective market behavior analysis, pay attention to the middle band (20-day SMA).
When prices consistently deviate from this line, you’re likely witnessing a strong trend in the making.
A failure test setup occurs when price briefly exceeds support or resistance levels before reversing.
Combining Bollinger Bands with candlestick patterns can provide reliable confirmation signals for trade setups.
Best Settings for Bollinger Bands in Trading
Now that you understand how Bollinger Bands reveal market volatility, let’s focus on optimizing your settings for maximum effectiveness. The standard configuration of 20-period SMA with two standard deviations works well for many traders, but you’ll want to customize these parameters based on your specific trading strategy and market conditions.
Your Bollinger Band customization should reflect your trading timeframe and asset characteristics. If you’re day trading with shorter intervals, you might benefit from a 10 or 14-period SMA for quicker signals. Much like the Mass Index reversals can signal market exhaustion, adjusting your band settings helps identify potential trend changes.
For longer-term positions, consider extending to a 50 or 100-period SMA to capture broader market trends. Market condition adjustment is something to be aware of – during high volatility periods, you’ll want to widen your bands by increasing the standard deviation setting above two.
On the flip side, when markets are calm, tighter bands can help you spot subtle trading opportunities.
Spotting Reversals Using Bollinger Bands Techniques
Identifying market reversals with Bollinger Bands requires careful attention to price interaction with the upper and lower bands. When you’re analyzing Bollinger Band setups, watch for price touches at the upper band (overbought conditions) or lower band (oversold conditions), as these often signal potential reversals.
To improve your price action approaches, you’ll want to focus on these key signals:
- Price touching or exceeding the upper band (potential downward reversal)
- Price touching or dropping below the lower band (potential upward reversal)
- Squeeze patterns, where the bands contract, indicating possible explosive moves
- Divergence signals between price and RSI for confirmation
Don’t rely solely on band touches, though. You’ll need to combine these signals with other indicators to confirm reversals.

For instance, if you spot price touching the upper band while the RSI shows overbought conditions, you’ve got a stronger reversal signal.
Remember that false signals/failed trades can occur, especially in trending markets where prices might hug the bands without reversing. Always consider the broader market context and use multiple technical indicators to validate your analysis.
Common Mistakes to Avoid with Bollinger Bands
While understanding reversal signals is important, knowing what not to do with Bollinger Bands can save you from costly mistakes.
One of the biggest errors you’ll want to avoid is relying only on the bands for entry signals without seeking trend confirmation from other indicators. Just because price touches a band doesn’t automatically mean it’s time to trade.
You’ll also need to watch out for failed breakouts, which often trap inexperienced traders who jump into positions too quickly. Remember, prices can stay outside the bands during strong trends, so don’t automatically assume a reversal is imminent.
Pay special attention to volatility squeezes, where the bands narrow significantly – these setups often precede major price moves, and missing them could cost you profitable opportunities.
Don’t forget to adjust your band settings. The standard 20-period moving average mightn’t work for your trading style or market conditions.
Most importantly, maintain proper risk management regardless of what the bands suggest. Set your stop-losses, manage your position sizes, and never let a single trade risk more than you can afford to lose.
Your Questions Answered
Can Bollinger Bands Be Combined With Other Technical Indicators for Better Results?
You’ll get stronger entry signal analysis by combining Bollinger Bands strategies with RSI, MACD, or volume indicators. This mix improves your risk management techniques and helps identify reliable volatility breakout trades.
How Often Should I Adjust Bollinger Band Settings During Different Market Conditions?
You’ll want to adjust your Bollinger Band settings when market volatility changes significantly. Monitor daily volatility and consider setting criteria changes every 2-4 weeks, depending on market phase responsiveness.
Are Bollinger Bands Equally Effective for All Types of Financial Instruments?
You’ll find Bollinger Bands’ effectiveness varies across financial instruments. They’re typically more reliable in forex and stocks but can show limitations with commodities, largely depending on each market’s unique volatility patterns.
What’s the Best Time Frame to Use Bollinger Bands for Day Trading?
You’ll find 15-minute and 1-hour time frames most effective for Bollinger Band basics. Consider market volatility impact when selecting intervals, and align your trade execution timing with your risk management strategies.
Do Bollinger Bands Work Better in Ranging or Trending Markets?
Bollinger Bands work effectively in both markets, but they’re especially powerful in ranging conditions where volatility creates clear boundaries. In trending markets, you’ll need to adjust band width for better signals.