- March 28, 2024
- Posted by: Shane Daly
- Categories: Day Trading, Trading Article, Trading Indicators
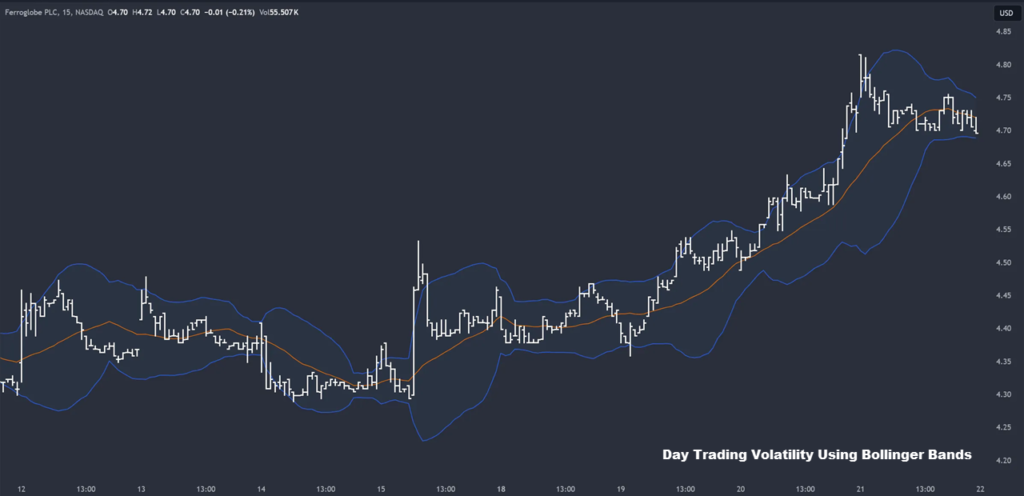
How to day trade volatility using Bollinger Bands? Look for the “squeeze” pattern where the bands contract, indicating low volatility, then enter a trade in the direction of the breakout when the bands start expanding again. During high volatility periods when the bands are wide, you can buy when the price touches the lower band and sell when it hits the upper band.
Understanding Bollinger Bands for Day Trading
Bollinger Bands, a key tool in day trading, uses a 20-day simple moving average alongside upper and lower bands based on standard deviations to evaluate price volatility. Day traders rely on Bollinger Bands to pinpoint potential entry and exit points by observing how prices interact with these bands.
| Key Points | Explanation |
| Bollinger Bands | Measure price movement around a moving average to identify volatility. |
| Entry/Exit Points | Adjust settings to capture short-term price movements for trades. |
| Price Dispersion | Wider bands indicate volatility expansion, presenting potential opportunities. |
| Risk Management | Use Bollinger Bands to manage risk and capitalize on price fluctuations. |
These bands provide a visual of market volatility, helping traders make better decisions during intraday trading. By monitoring price movements around the bands, traders can capitalize on short-term trading opportunities that occur and it is all based on price action.
The flexibility of Bollinger Bands in expanding and contracting in response to market volatility enables traders to use their strategies to find trading opportunities in different phases of price action.
Customizing Bollinger Bands Settings
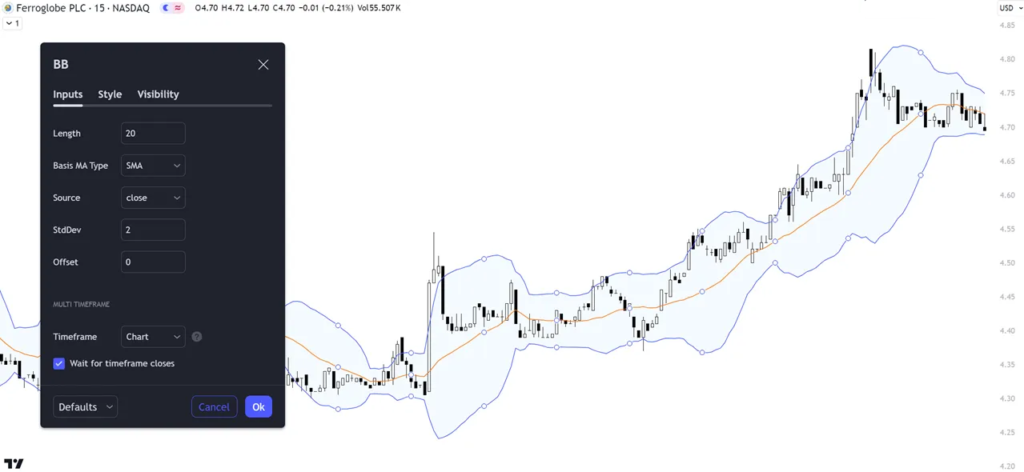
Think of Bollinger Bands like elastic bands around the price of an instrument. You can adjust these bands to fit your trading style:
- Changing the Length: Usually, traders look at the average price of the last 20 days, but you can choose a different number of days. This is deciding how many days of price history you want to consider to get your average.
- By changing the standard deviation (a fancy term for measuring how much prices go up and down), you can make the bands wider or tighter. Wider bands mean you’re keeping an eye on bigger ups and downs in price
- Exploring Moving Average Types: Experimenting with different moving average types such as exponential moving averages (EMA) can provide diverse insights into price trends. Choosing the right moving average type can align the Bollinger Bands more closely with a trader’s specific trading style, reducing the occurrence of false signals and enhancing overall trading accuracy.
Practical Applications in Day Trading
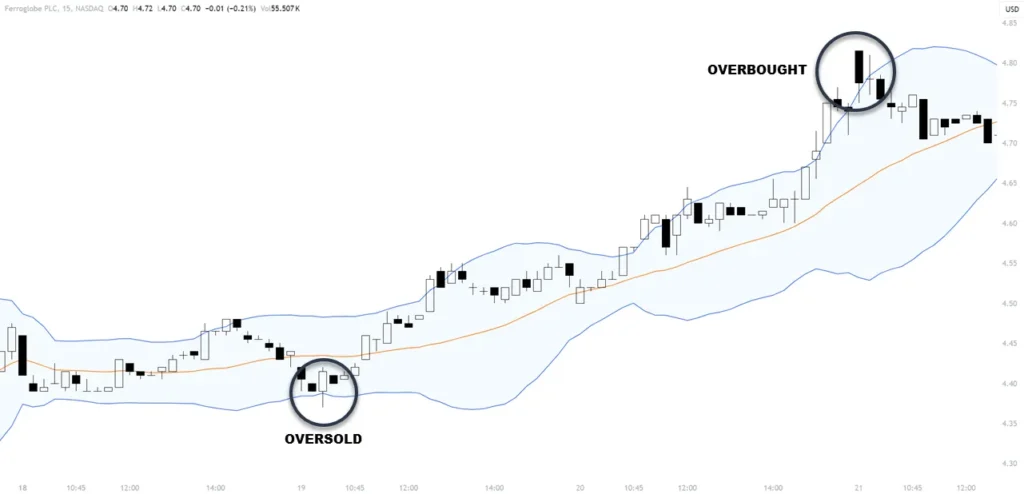
By using Bollinger Bands, traders can also identify overbought and oversold conditions in the market, helping with their decision-making process. Observing band-width changes is valuable as it allows traders to anticipate shifts in volatility throughout the trading day, helping show when adjustments are needed in the trading strategy.
Additionally, Bollinger Bands assists day traders in setting appropriate stop-loss and take-profit levels based on the overall volatility levels, improving risk management practices.
Incorporating Bollinger Bands into day trading strategies not only improves decision-making but also provides a structured approach to managing risks effectively.
Day Trading Strategies With Bollinger Bands
Day trading strategies with Bollinger Bands revolve around the identification of entry signals, the implementation of risk management techniques, and the execution of profit-taking strategies.
By monitoring price movements relative to the bands, day traders can pinpoint ideal entry points while mitigating potential losses through effective risk management.
Setting profit-taking levels based on volatility and price action helps traders maximize gains and maintain a disciplined approach to trading.
Entry Signals Identification
When using Bollinger Bands for day trading, recognizing entry signals becomes essential for executing successful trading strategies.
- Day traders look for price touches on the lower band/middle line in uptrends or the upper band/middle line in downtrends to signal potential entry points.
- Combining Bollinger Bands with indicators like MACD can provide confirmation signals for market entries.
- Traders also analyze candlestick patterns near the bands to validate their entry decisions.
Risk Management Techniques
Using effective risk management techniques is important when applying Bollinger Bands in day trading strategies to safeguard capital and optimize trading outcomes. Utilize tight stop-loss orders to control risk, proper position sizing based on volatility, and set profit targets to secure gains.
Incorporate trailing stops to lock in profits and limit losses, while evaluating risk-reward ratios for better trade selection. Maintaining discipline is important in sticking to these risk management strategies, ensuring a structured approach to day trading with Bollinger Bands.
| Risk Management Techniques | Day Trading Strategies With Bollinger Bands |
| Tight Stop-Loss Orders | Control risk and protect capital |
| Proper Position Sizing | Based on volatility for effective risk management |
| Profit Targets | Secure gains and maintain discipline for closing trades |
| Trailing Stops | Lock in profits during a trending move and limit potential losses |
Profit Taking Strategies
To capitalize on price movements identified by Bollinger Bands, day traders can design profit-taking strategies tailored to maximize gains in volatile market conditions.
- Day traders can have profit-taking strategies by selling when prices reach the upper band in overbought conditions indicated by Bollinger Bands.
- Setting specific profit targets based on price movements relative to the bands can help day traders lock in gains.
- Combining Bollinger Bands with other indicators can confirm profit-taking signals (short-term moving average price cross)
Bollinger Band Day Trading Plan
Here’s a detailed day trading strategy revolving around the use of Bollinger Bands. Ensure to test it and adapt it to your understanding of trading.
Trading Strategy Overview
Objective: To capitalize on price movements by identifying entry and exit points using Bollinger Bands along with other indicators for confirmation.
Timeframe: Day trading (short-term trades held within the same trading day).
Market Conditions: Adaptable to different market conditions but requires adjustment based on whether the market is trending, ranging, or experiencing high volatility.
Components of the Strategy
- Bollinger Bands Setup:
- Middle Band: 20-period Simple Moving Average (SMA).
- Upper and Lower Bands: Set at 2 standard deviations from the SMA.
- Confirmation Indicators (optional):
- Relative Strength Index (RSI): To confirm overbought or oversold conditions.
- Moving Average Convergence Divergence (MACD): To confirm the trend’s direction and strength.
- Chart Timeframe: 5-minute or 15-minute charts for more frequent trading signals.
Trading Rules
- Entry Points:
- Bollinger Band Squeeze: Enter in the direction of the breakout when the bands contract closely and then start expanding, signaling increased volatility and potential breakout.
- Touching Middle Line in Uptrends: Buy above the high when the price touches the middle band during an uptrend after piercing the upper band, confirmed by RSI indicating oversold conditions and MACD supporting the uptrend.
- Touching Middle Band in Downtrends: Short-sell when the price touches the middle band during a downtrend after piercing the lower band, confirmed by RSI indicating overbought conditions and MACD supporting the downtrend.
- Exit Points:
- Profit Targets: Set a profit target near the opposite band (e.g., if buying near the lower band, target near the upper band).
- Stop-Loss Orders: Place a stop-loss order slightly below the recent low for long positions or above the recent high for short positions to limit potential losses.
- Trailing Stops: To lock in profits as the trade moves in your favor, trail the middle line in strong trends.
- Risk Management:
- Limit risk to a small percentage of the trading account per trade (e.g., 1-2%).
- Adjust position size based on the stop-loss level to maintain consistent risk.
Strategy Adaptation for Different Market Conditions
- Trending Markets: Focus on Bollinger Band Bounce and Ride strategies (trade 1).
- Ranging Markets: Use the Squeeze strategy to identify potential breakouts.
- Volatile Markets: Be cautious; consider tighter bands (1.5 standard deviations) and combine with volume indicators for additional confirmation.
Additional Considerations
- Always use Bollinger Bands with other indicators and chart patterns.
- Be aware of major economic news or events that can cause increased volatility.
- Backtest and paper trade the strategy before implementing it with real capital.
- Continuously review and adjust the strategy based on changing market conditions and trading performance.
Example Trades
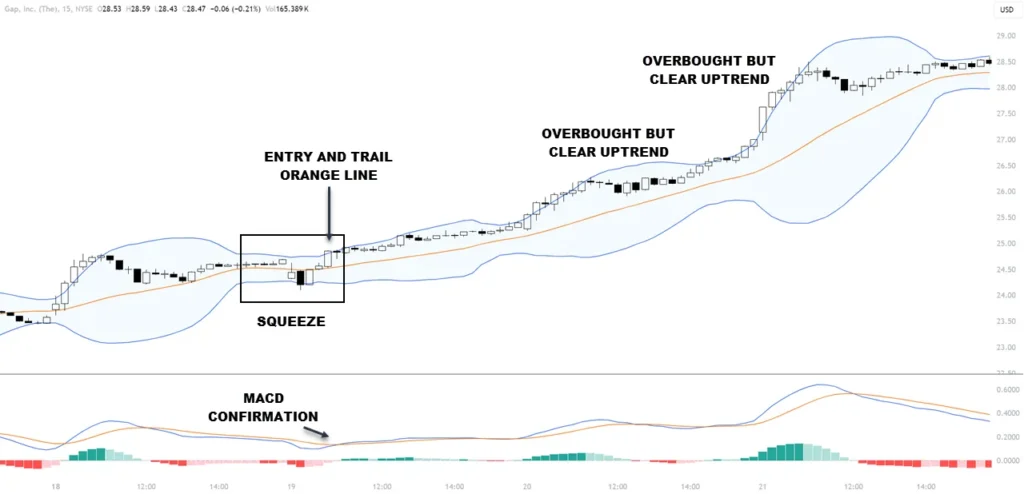 Trade 1: Buying on a Bollinger Band Squeeze
- The chart shows an uptrend with Bollinger Band squeezing.
- MACD hooks up while the price is breaking the top of the band confirming momentum growth
- Trade trailed on 20 SMA and close before end of the day
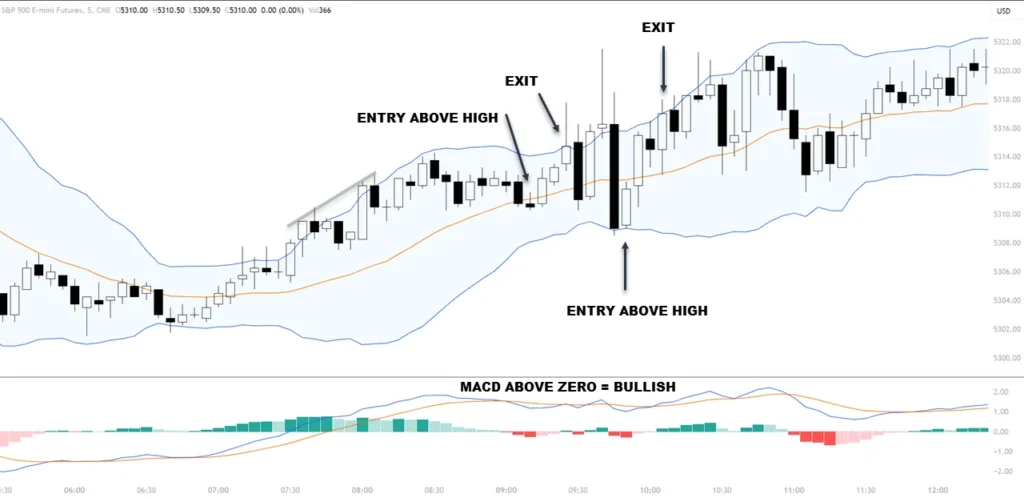 Trade 2: Touching Middle Line in Uptrends
- The price breached the upper line on both trades
- MACD above zero line is bullish
- Buy on a break of candle that touched the middle line. If not triggered, move entry down to the next candle (trade 2)
- Profits taken at the upper band
This strategy provides a structured approach to day trading using Bollinger Bands, emphasizing the importance of confirmation, risk management, and adaptation to different market conditions. Remember, no strategy guarantees success; continuous learning and adaptation are key to trading.
Combining Bollinger Bands With Indicators
By combining Bollinger Bands with various technical indicators, traders can improve their analysis and decision-making processes in day trading volatility. Combining Bollinger Bands with the Relative Strength Index (RSI) can help confirm trading signals and identify potential reversals.
Oscillators like the Moving Average Convergence Divergence (MACD) can be used alongside Bollinger Bands to enhance trend analysis and signal accuracy. The Stochastic Oscillator combined with Bollinger Bands offers insights into overbought and oversold conditions, aiding in decision-making for trade entries and exits.
The Average True Range (ATR) indicator with Bollinger Bands can provide a detailed view of market volatility and potential price movements.
Using Bollinger Bands with volume indicators like On-Balance-Volume (OBV) can help validate price trends and signal the strength of market movements.
| Indicator | Use Case |
| Relative Strength Index (RSI) | Confirming signals, identifying reversals |
| Moving Average Convergence Divergence (MACD) | Enhancing trend analysis, improving signal accuracy |
| Stochastic Oscillator | Insight into overbought and oversold conditions, aiding in trade decisions |
| Average True Range (ATR) | Providing a view of market volatility and potential price movements |
| On-Balance Volume (OBV) | Validating price trends, indicating market movement strength |
Tips for Successful Day Trading
To succeed in day trading with Bollinger Bands, you want to implement effective risk management strategies and use the technical analysis tools that support your trading.
Risk Management Strategies
Effectively managing risk is a key aspect of successful day trading, requiring various strategies to protect capital and maximize profits in volatile market conditions.
When day trading with Bollinger Bands:
- Implement stop-loss orders to limit potential losses and safeguard capital.
- Use position sizing techniques to manage risk based on account size and risk tolerance.
- Consider setting profit targets to secure gains and avoid holding positions for too long.
These strategies help day traders manage the price fluctuations and volatility inherent in trading environments, ensuring a structured approach to risk management and enhancing the potential for successful trades.
Summary
Understanding and utilizing Bollinger Bands in day trading can provide valuable insights into market volatility and potential price movements. Traders can improve their decision-making process by customizing settings, applying practical strategies, and combining them with other indicators.
Success in day trading using Bollinger Bands requires discipline, patience, and continuous learning. By following these tips and staying informed, traders can increase their chances of making better trades as they tackle day trading for a living.
FAQ
How can Bollinger Bands be used to gauge market volatility?
Bollinger Bands expand and contract based on the volatility of the underlying asset. When the bands widen, it indicates increased volatility, while narrowing bands signal decreased volatility. Traders can use this to anticipate potential breakouts, as volatility tends to expand after a period of contraction.
What are the optimal Bollinger Band settings for intraday trading?
For intraday trading, a common setting is a 20-period simple moving average with bands set at 2 standard deviations. However, shorter periods like 9 or 14 can also be used for increased sensitivity to price movements during the trading day.
Can Bollinger Bands be used profitably for trading?
Bollinger Bands alone do not guarantee profitable trading, as they focus solely on price and volatility while ignoring other factors. Using only the bands to enter and exit trades is considered a risky strategy. They should be combined with other technical indicators and analyses for better trade signals.
What is the ideal timeframe for using Bollinger Bands?
Bollinger Bands can be applied to any timeframe, from intraday charts to weekly or monthly charts. The choice depends on the trading style and objectives of the trader. Shorter timeframes are more suitable for active intraday trading, while longer timeframes may be better for position trading.
What is the best Bollinger Band trading strategy?
One popular strategy is the “Double Bollinger Bands” which uses two sets of bands with different standard deviation values (e.g. 2 and 1). Trades are taken when the price squeezes between the two band sets and then breaks out. However, there is no single “best” strategy, as strategies need to be adapted to different market conditions.
How can traders use Bollinger Bands effectively?
To use Bollinger Bands effectively, traders should combine them with other technical indicators, analyze the overall trend direction, and look for mean reversion setups in range-bound markets or trend continuation signals in trending markets. Effective risk management is also crucial when trading with Bollinger Bands.

