- June 16, 2022
- Posted by: Shane Daly
- Category: Trading Article
While talking about bull markets during this current decline seems premature, eventually the upside will resume. When it does, being ready with a plan of attack for how you will take advantage of fresh upside moves, is vital. No need to reinvent the wheel with elaborate trading strategies full of redundant indicators and candlestick patterns.
Determine the trend and use two simple chart patterns that tell a tale about the instrument you are trading. Once the reversal is in play, set yourself up with a trigger and get into the trade. This has been a tried and tested approach for decades and in all market conditions. This article will just focus on the upside and if you simply reverse everything you will read, you can get involved in the downside.
How Do Chart Patterns Work?
When considering chart patterns, focusing on the underlying causes of why they are forming is the best approach. Sure, you can just trade the pattern without understanding it. However, knowing the imbalance that is causing them is better because you can begin to grade the pattern. Trade the best ones that are setting up and skip the rest.
In essence, chart patterns form when there is an imbalance of upside/downside interest. Eventually, one side begins to take over, in our case upside interest, and the trend continues.
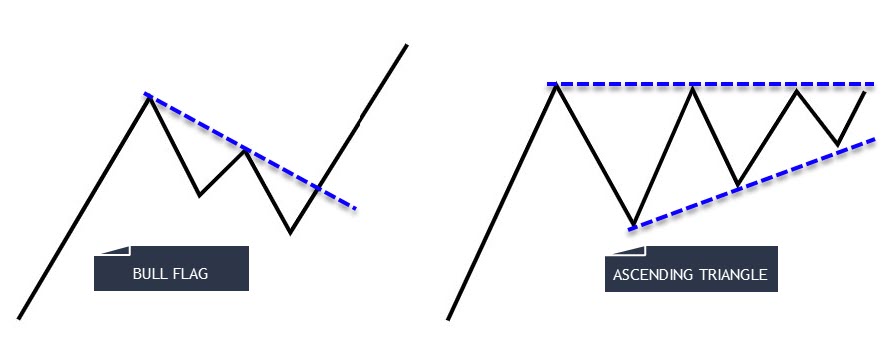 The two patterns we will focus on when considering the upside are:
+ Ascending Triangle
Only two patterns out of many available but many chart patterns are just an slight variation of another. Again, know the imbalance and you don’t need a truckload of patterns to look for.
Breaking Down The Bull Flag
Think of the bull flag as a pause in the uptrend of the instrument. Profit taking occurs (yes, we may also be seeing shorts enter) and eventually that begins to stall. We get a reversal and off once again to the upside.
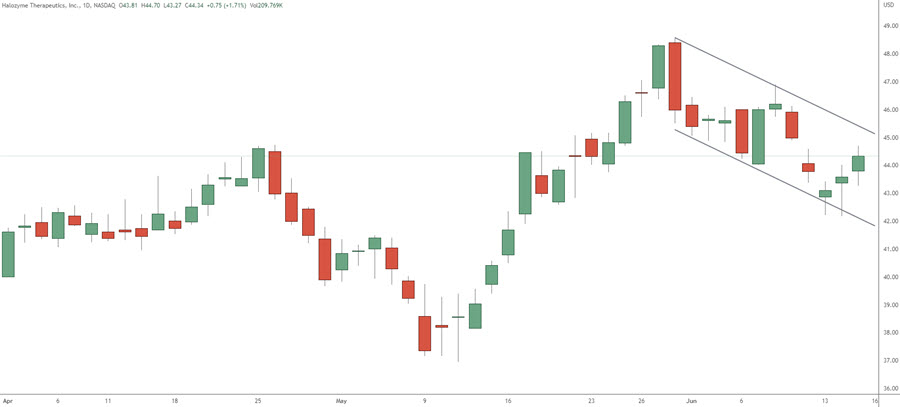 The pullback will come in two general forms. The one shown here is a complex pullback. Price tries to resume to the upside only to be met with fresh sellers. Once longs see the potential lower high being put in, some weak holders will exit. Eventually, if the up trend is to stay intact, price will need to stop putting in lower lows and start taking out the recent swing highs.
The second variation is one leg down and then a resumption to the upside. For both variations, the key is to not see sustained momentum during the pullback phase. When looking to get long, we don’t want to see strong selling out of positions or sellers entering the market.
Simple pattern that have stood the test of time, work. As long as we don’t see strong downside momentum during the corrective phase, we can consider buys once a trade entry trigger has fired off.
Beauty Of The Ascending Triangle
The ascending triangle shows you that people are still buying at higher prices even though the highest price hasn’t moved. What would cause people to buy at higher prices? Just like in the everyday society, strong demand for something will have people buying even as prices increase. Couple that with a healthy uptrend, you could be looking at gaining some profits.
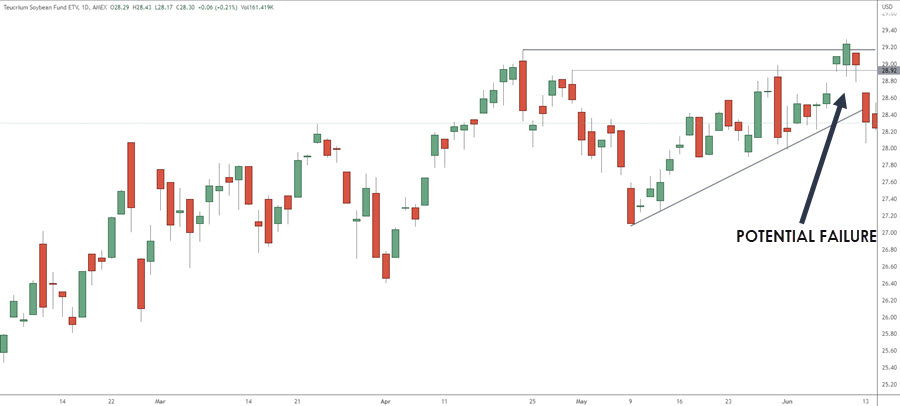
We can see the swing high and then price pulls back. Price doesn’t just drive back into resistance but begins to make higher lows into resistance. Some will describe this as “stored energy” but that is a silly description. There’s no energy, there is just buying and selling. What is important is we are seeing buying at higher prices even before the extreme high was taken out.
Difference Between Ascending Triangle and Bull Flag
Notice that with the bull flag, we are buying at the end of the decline and as the reversal takes place. We are essentially buying the turn. The good thing about buying the turn is you already have a built in area where the protective stop loss can be placed. It does get a little tricky when considering a complex correction as you can see below.
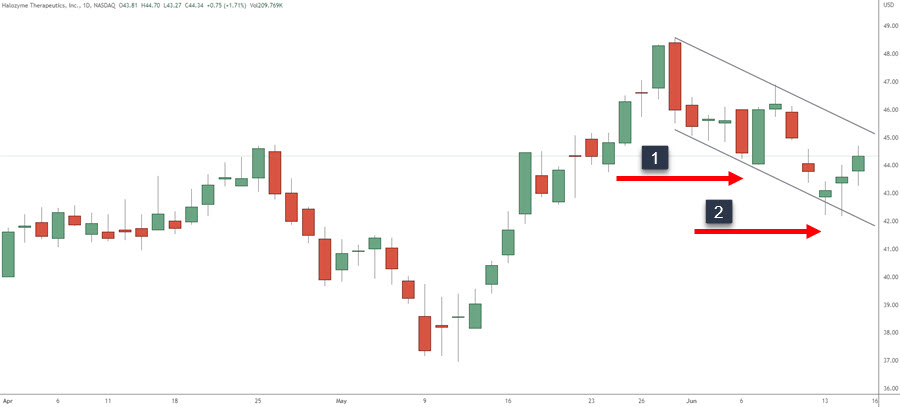
Imagine a simple correction takes place (one swing down) and you enter on the strong momentum green candlestick. Your stop would be placed under the low around number “1”. Price has different plans and reverses back to the downside. The second push up gives you a swing low at “2” for your stop.
When looking at trading an ascending triangle, we are looking to trade a breakout around the last swing high. There are certain things to look for when trading breakouts including a tight consolidation just under the resistance zone which we don’t get in this example.
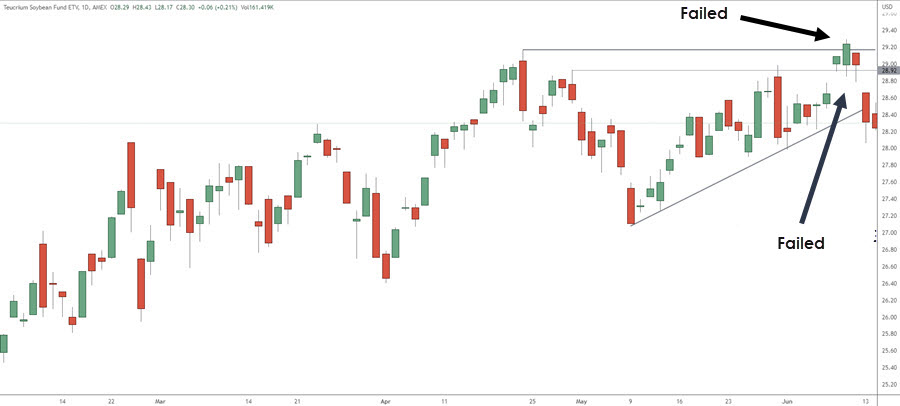
This article on trading breakouts will help you find what to look for when this pattern sets up. There are also a few ways you can place your stop loss including under the extreme low of the pattern or someplace inside the base.
Important points: Bull flags take advantage of the reversal back in the trend direction. Ascending triangle looks to trade a breakout into new highs.
Benefits Of These Patterns
These patterns have different uses and take advantage of two things: catching the turn back in the trend direction and break outs in the trend direction after a tight consolidation. You can use both during a move or the one that gives the best odds.
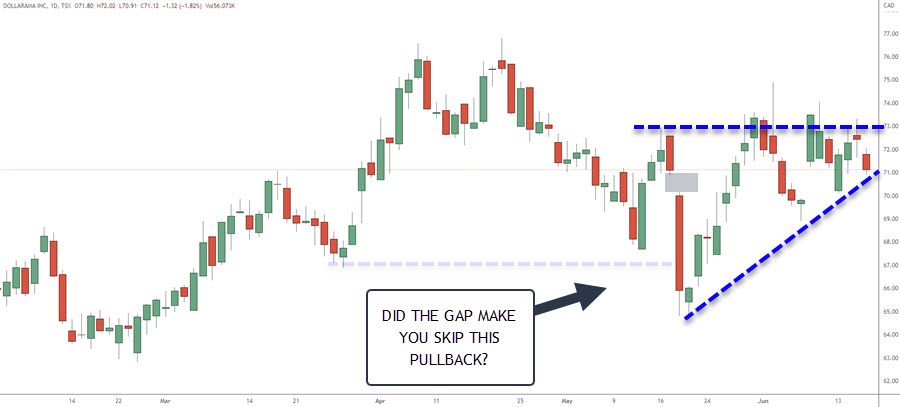
Assume you were watching this stock and while it was having a “lazy” pullback, it also gapped down into an exhaustion thrust as it tested prior support. Perhaps you couldn’t find an entry on this or a lower time frame to get in near the bottom of the bull flag.
What do you do next?
We see an ascending triangle formation and although we want to see more coiling action under resistance, you keep this on your radar for a potential future trade.
Two In One
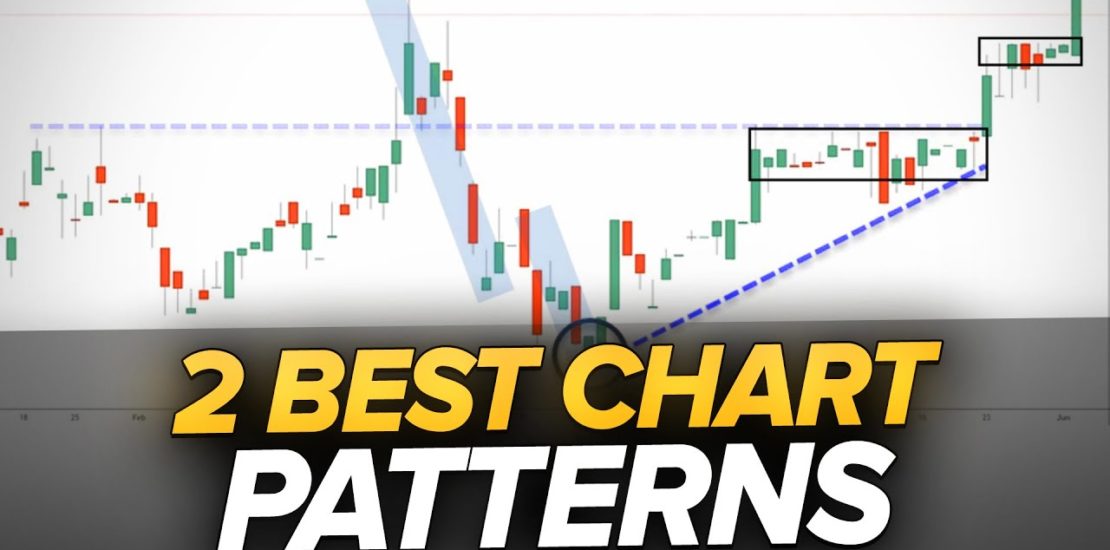
Let’s imagine you come across the following chart. After a one leg bull flag on the left, we get a two leg move to the downside. Your trading plan allows this trade and you find an entry around the black circle.
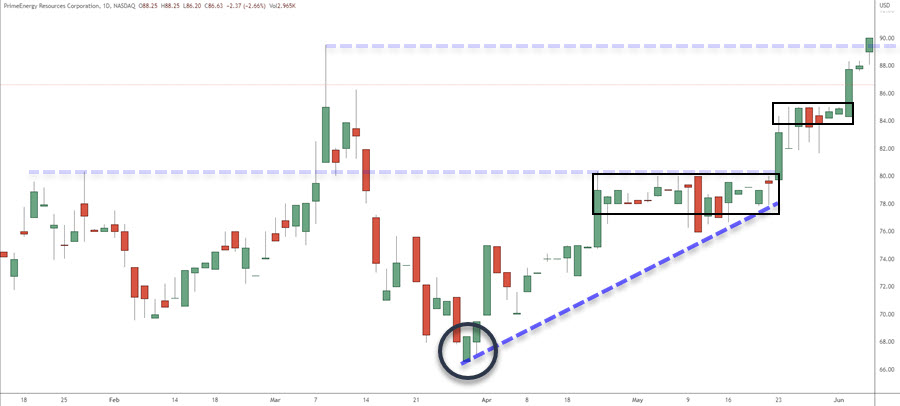
Price grinds higher and finds resistance on the inside of the extreme high (read this article for more instruction on these). We see the ascending triangle and then basing under resistance. These can make for higher probability setups and you enter on the breakout or inside the small consolidation. Price moves higher and if you extend the dark blue line, you see our ascending triangle is still ongoing. You see the tight consolidation and take an entry.
Finally, price begins to break to the upside and you have another entry while you are in profit on both the bull flag reversal and the breakouts.
In Conclusion
Two simple patterns that serve two different purposes that you should add to your toolbox. Once you define the trend, looking for these two patterns will help you get involved in upside moves of any trading instrument.
Are they perfect? Of course not and that is why you need to ensure you have a protective stop loss in place. However, trading in the direction of the trend, whether through a reversal to the upside or a break to new highs, is an extremely viable approach. Search our blog for more articles on breakouts, chart patterns and profit targets to help design a complete trading plan.
