- June 16, 2024
- Posted by: Shane Daly
- Categories: Advanced Trading Strategies, Trading Article
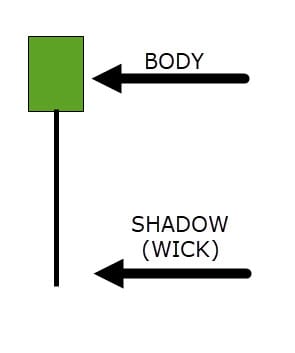
To master the Hammer candlestick for spotting reversals, you must first understand its structure: a small body at the top with a long lower shadow. This formation signals a bullish reversal when observed after a downtrend, particularly if the following candle closes above the Hammer’s high.
Use a structured and disciplined entry strategy: validate the signal with a confirmation candle, set a stop loss below the Hammer candle low, and use profit targets. Support and resistance levels will refine your entries and exits.
Combining this pattern with additional technical indicators improves its reliability. With these tactics, you’re ready to capitalize on reversal opportunities.
A New Breakout Trading Strategy! Download Here Now.
Main Points
- Identify the hammer pattern during a downtrend, marked by a small body at the upper end and a long lower shadow.
- Confirm the reversal with a subsequent candle closing above the hammer’s high to validate the bullish signal.
- Place a stop-loss order below the low of the hammer candlestick to limit potential losses if the reversal fails.
- Utilize support and resistance levels to enhance entry and exit strategies, ensuring precise and strategic trading decisions.
- Combine the hammer pattern with technical indicators like moving averages and volume analysis for a robust trading approach.
What is a Hammer Candlestick Pattern?
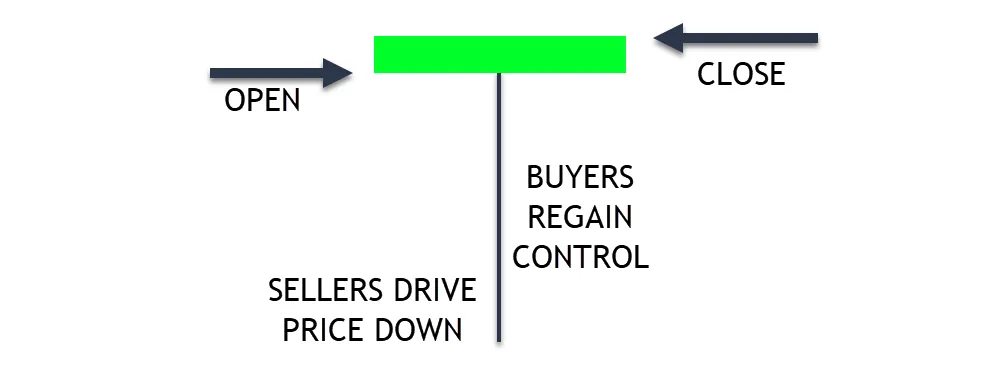
The hammer candlestick pattern is a candle with a short body at the upper end and a long lower shadow, typically twice the body’s length, signaling a potential bullish reversal.
Understanding variations, like the inverted hammer, is essential as they subtly differ in what they mean for the market and can effectively guide your entry and exit strategies.
Identifying the Hammer Pattern
As you analyze the hammer candlestick pattern, focus on its key characteristics:
a small body at the top of the trading range and a disproportionately long lower wick.
This configuration signals a bullish reversal, especially when it occurs after a sustained downtrend.
You must verify that the lower wick is at least twice the length of the body to confidently identify this pattern in your trading charts. In trading, close is close enough and an obvious long tail (wick) holds the same meaning.
Key Characteristics
Identifying the hammer candlestick pattern involves recognizing its unique structure: a small body at the upper end of the trading range with a long lower wick, where the close, open, and high prices cluster near each other.
Understanding this candlestick anatomy and price action is essential. It reflects market psychology, which drives technical analysis and trend identification, signaling potential momentum shifts without predicting bullish reversals explicitly.
Bullish Reversal Signal
Understanding the hammer candlestick pattern begins with recognizing its role as a bullish reversal signal following a downtrend, indicating potential shifts in market control from sellers to buyers. This shift reflects a change in market sentiment, usually obvious in the price action where the long lower wick signals buying pressure.
Your technical analysis approach should consider this pattern to anticipate trend reversals, influenced by candlestick psychology.
Variations of the Hammer
You’ll see several variations of the hammer candlestick pattern, each signaling different market implications.
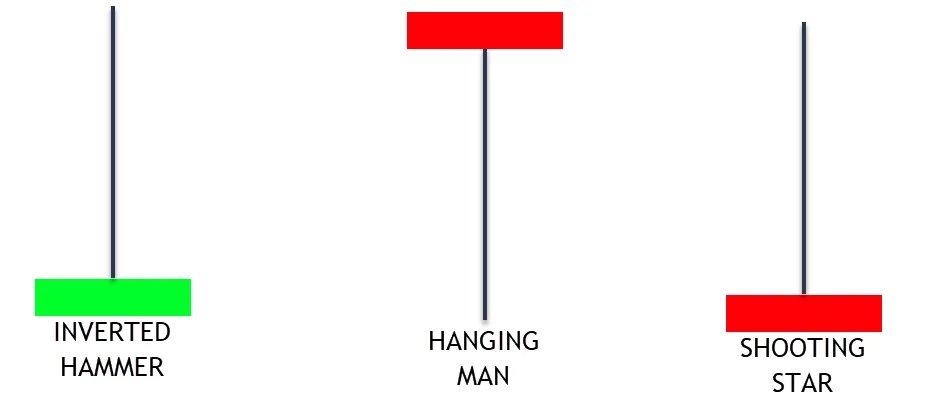
The Inverted Hammer, characterized by a small lower body and a long upper wick, suggests a potential bullish reversal after a downtrend.
The Hanging Man and Shooting Star formations, though visually close to the hammer, typically indicate bearish reversals when appearing after an uptrend.
Inverted Hammer
While the standard hammer candlestick signals a bullish reversal with its long lower shadow and small upper body, the Inverted Hammer, characterized by a small real body at the lower end and a long upper shadow, indicates that buyers are beginning to dominate despite the prevailing downtrend.
| Aspect | Detail |
|---|---|
| Position | Bottom of downtrend |
| Body | Small, lower end |
| Shadow | Long, upper |
| Implication | Possible trend reversal, buyer power |
Hanging Man
How can traders identify a potential market peak? Look for the hanging man pattern, a bearish reversal indicator that emerges after a price advance.
This pattern, characterized by a small body atop a long lower shadow, signals a shifting market sentiment from buyers to sellers.
Looking into candlestick psychology, the hanging man’s appearance in price action alerts traders to adjust strategies/positions, if they understand the technical analysis of candlestick formations and meaning.
Shooting Star
Often appearing at the climax of an uptrend, the Shooting Star pattern signals a potential shift from bullish to bearish sentiment. This bearish reversal is important in candlestick analysis, highlighting significant price action.
The long upper shadow and small body reveal market psychology, indicating sellers overpowering buyers. You’ll need to verify with the next several candles to confirm this trend reversal, ensuring a methodical approach to your trading decisions.
How to Trade the Hammer Pattern
When you encounter a hammer pattern, your first step should be to determine an entry strategy; typically, this involves confirming the pattern with the next candle before making a move.
You’ll need to place your stop loss below the hammer’s low to mitigate risk effectively (simple approach).
Lastly, setting up a profit-taking strategy that seeks at least twice the amount risked can maximize your potential returns from the trade.
Entry Strategies
When you’re considering entry strategies for trading the hammer pattern, you must first look for a confirmation candle to verify the pattern’s reliability.
Look to assess support and resistance levels; these will help with your decisions on where to set stop losses and determine potential exit points.
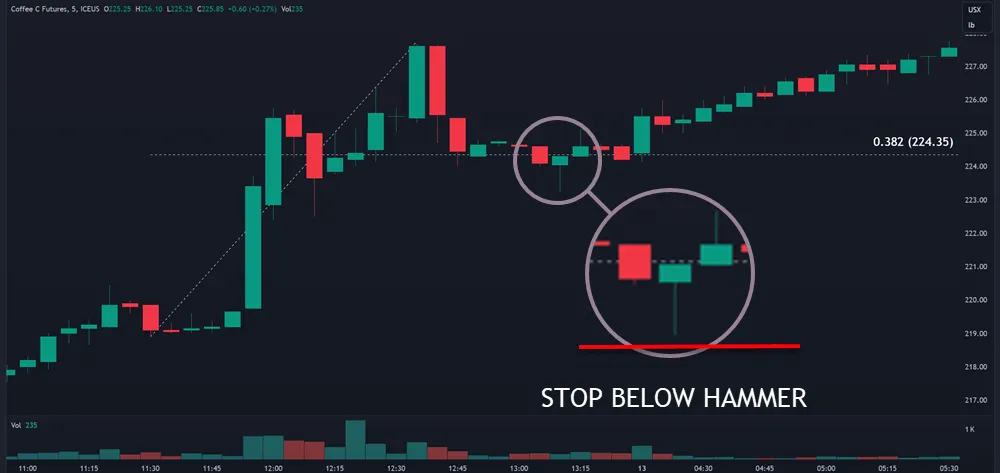
Additionally, try using tools like Fibonacci retracements and pivot points that can refine your entry and exit strategy, improving your trade’s potential for success.
Confirmation Candles

Consider how to utilize confirmation candles, which validate the pattern by closing above its high, which may enhance the reliability of your entry strategy.
- Candlestick Patterns: Study the hammer and its confirmation candle to master this aspect of technical analysis.
- Price Action: Observe how prices react post-hammer to gauge market psychology.
- Trading Strategies: Integrate confirmation candles into your trading plan to refine entry points.
Support/Resistance Levels
Understanding how the hammer pattern interacts with established support and resistance levels can improve your entry strategies.
By adding in candlestick analysis, you’ll observe price action responding to these key price levels, which helps you with trend identification.
As a result, you’ll utilize these times when certain candlesticks meet support/resistance zones to capitalize on potential reversals with greater precision.
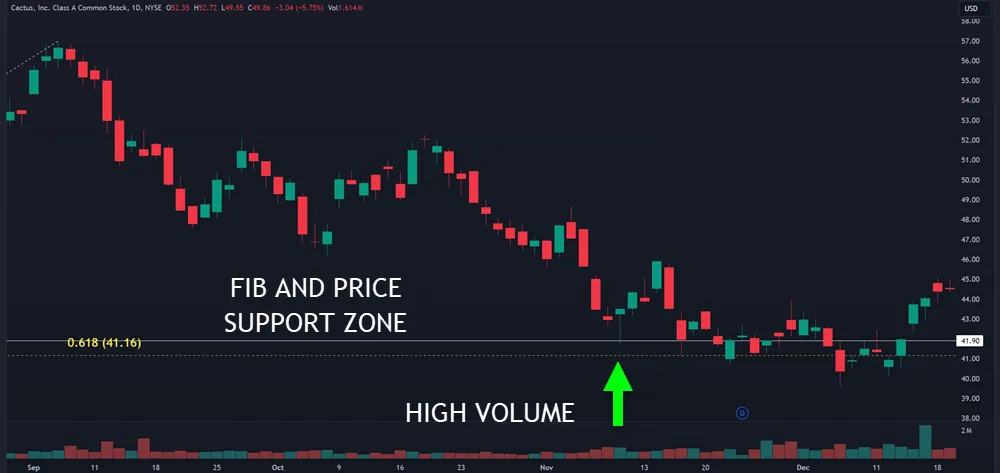
Fibonacci Retracements
How can you utilize Fibonacci retracements to improve your entry strategies with the hammer pattern in trading?

- Identify Support Levels: Look for hammer patterns at key Fibonacci levels like 38.2% or 61.8% and 78.6% to confirm bullish reversals.
- Set Price Targets: Use Fibonacci extensions to establish precise price targets for trend continuation.
- Incorporate Fibonacci Fans: Combine Fibonacci fans and harmonic patterns to refine entry points and optimize trade setups.
Pivot Points
Building on your knowledge of Fibonacci retracements, consider how pivot points can further refine your entry strategies when trading the Hammer pattern.
By adding in pivot point strategies with candlestick analysis, you’re tapping into market psychology to gauge price action more effectively.
This confluence strengthens trend identification, offering robust entry points that align with real-time market dynamics, thereby enhancing the precision of your trading decisions.
Stop Loss Placement
To manage downside risk when trading the hammer pattern, you should place your stop loss order just below the low of the hammer candlestick. This placement not only caps your potential losses if the market moves against your position but also aligns with essential trading principles such as risk mitigation and position sizing.
Here are several key points to keep in mind:
- Risk Mitigation: Placing your stop loss below the hammer’s low allows you to control the exact level of risk you’re exposed to. This is important in maintaining not just the viability of the individual trade, but also the overall health of your trading capital.
- Position Sizing: By understanding the distance between your entry point and your stop loss, you can adjust the size of your position according to the risk you’re willing to take. This is particularly important in volatile markets where the hammer formation might occur.
- Market Conditions and Trend Analysis: Always take into account the broader market conditions and current trends in your analysis. Volatility adjustment is necessary because it may affect the hammer’s reliability. A thorough trend analysis can further confirm if the hammer truly signals a potential reversal, enhancing your overall strategy’s effectiveness.
Profit-Taking Strategies
When you’re trading the hammer pattern, establish a clear profit-taking strategy to optimize your gains while minimizing risks.
You’ll need to calculate risk-reward ratios that justify your trades, typically aiming for a minimum of a 1:2 ratio where your potential profit is at least twice your potential loss. Keyword: potential. Trades are never guaranteed to hit profit targets.
Additionally, implementing trailing stops can help you lock in profits while allowing the position to run, maximizing potential returns as the market moves in your favor.
Risk-Reward Ratios
As you consider profit-taking strategies for the hammer pattern, aim for a risk-reward ratio of at least 2:1 to maximize your gains while effectively managing risks.
- Position Sizing: Adjust your position size to manage exposure and boost potential returns without overextending your portfolio.
- Risk Management: Set stop-loss orders strategically to protect your capital.
- Reward Ratios: Target profit levels that reflect a minimum of double your risk to optimize return on investment.
Trailing Stops
Building on risk management strategies, consider using trailing stops to lock in your gains and capture further upside when trading the hammer pattern.
Trailing stop strategies, are essential for volatility management, adapting to market conditions, and ensuring ideal trailing stop adjustments. Using these techniques follows trend movements and price action closely, improving risk control through strategic trailing stop placement.
Combining the Hammer with Other Indicators
To improve your trading strategy using the hammer candlestick, it’s vital to use it with other technical indicators.
You can use moving averages to gauge the prevailing trend momentum and confirm the hammer’s reversal signal, ensuring a more reliable trade setup.
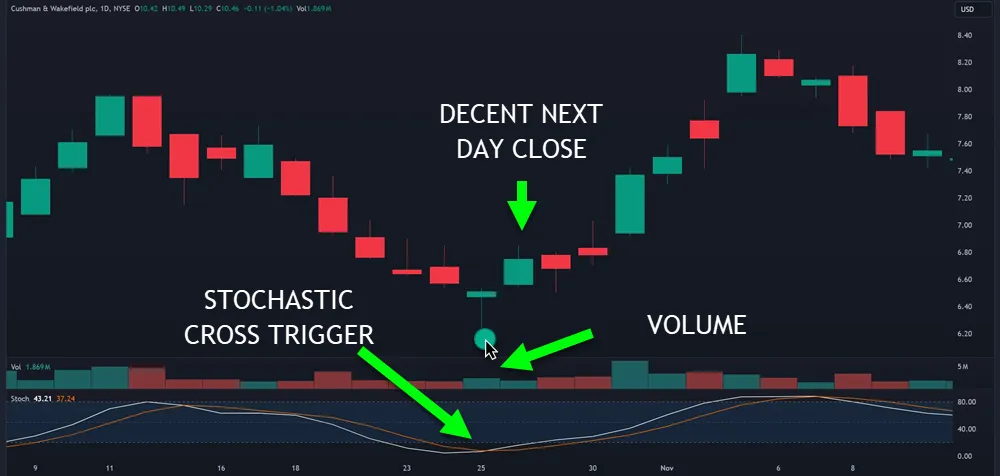
Combining oscillators like RSI or Stochastic can help assess the market’s overbought or oversold conditions, complementing the reversal indication provided by the hammer pattern.
Moving Averages
When combining hammer patterns with moving averages, you’ll find these tools invaluable for confirming trend reversals and establishing robust trading strategies. The importance of moving averages lies in their ability to smooth out price data, providing clearer signals about the market’s direction.
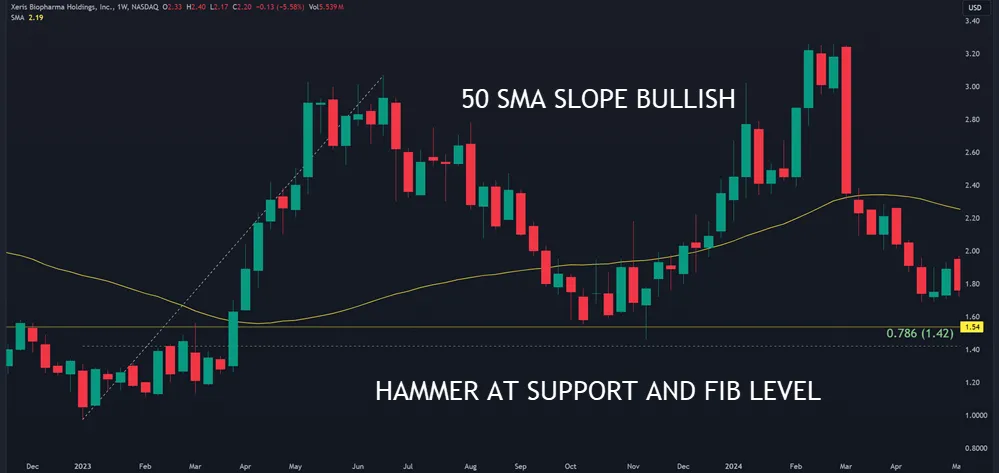
This clarity is essential when you’re trying to confirm the potential reversals indicated by a hammer pattern.
Here’s how you can effectively combine these two powerful tools:
- Trend Confirmation:
Always check the position of the hammer relative to a moving average. If a hammer forms near a significant moving average like the 50-day or 200-day, it often suggests a stronger potential for reversal. The alignment provides a visual confirmation that the trend might be exhausting and a reversal is pending. - Cross Signals Analysis:
Pay attention to moving average crossovers such as the Golden Cross or Death Cross. These occur when shorter-term moving averages cross above or below longer-term ones, respectively. A hammer pattern that appears around these crossovers can significantly reinforce the signal of a trend change. - Support and Resistance Levels:
Moving averages can act as dynamic support or resistance levels. A hammer forming near these levels can indicate that the price is testing and potentially rejecting these key price points, enhancing the likelihood of a successful trade.
Oscillators (RSI, Stochastic)
While the hammer candlestick pattern provides a solid basis for identifying potential reversals, integrating oscillators like RSI and Stochastic can refine your analysis and improve trade accuracy. The Relative Strength Index (RSI) shows RSI divergence when the price forms a new low but is not followed by the RSI.
This discrepancy can be a strong indicator that the downtrend is losing momentum, aligning well with the optimistic signal a hammer pattern suggests.

The Stochastic oscillator (my favorite indicator when I started trading) offers valuable Stochastic signals by marking overbought and oversold conditions. When you notice the hammer pattern during oversold conditions on the Stochastic, it typically indicates a higher likelihood of a bullish reversal.
If the Stochastic shows overbought conditions without a corresponding hammer, it might be smart to wait for further confirmation.
This multi-indicator approach reduces risk and improves decision-making, providing a more robust framework for your trades.
Volume Analysis
Using volume analysis with the hammer candlestick pattern improves your ability to confirm potential bullish reversals. When you’re looking at this pattern, understanding the underlying volume trends can provide insights into market participation and improve signal reliability.
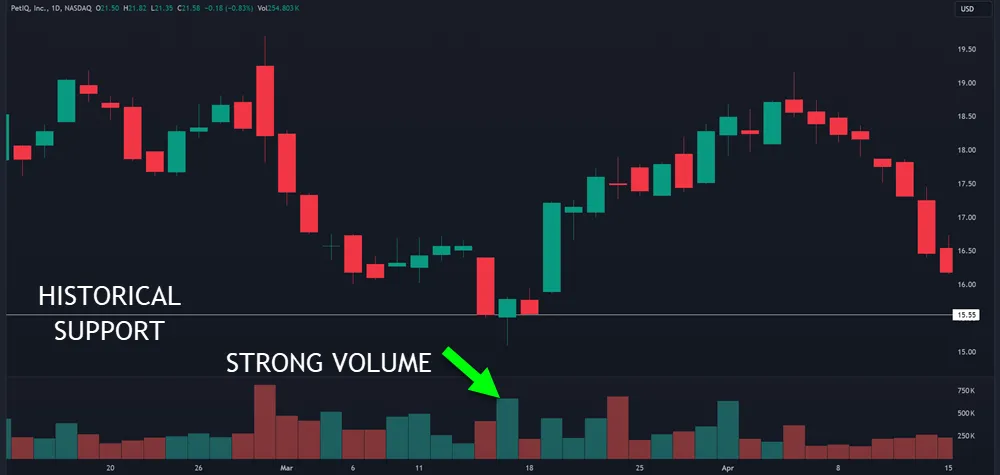
Volume acts as a trade validation tool, making it essential to assess whether a trend reversal indicated by a hammer is genuinely credible.
Here are three key ways to use volume analysis effectively with the hammer candlestick:
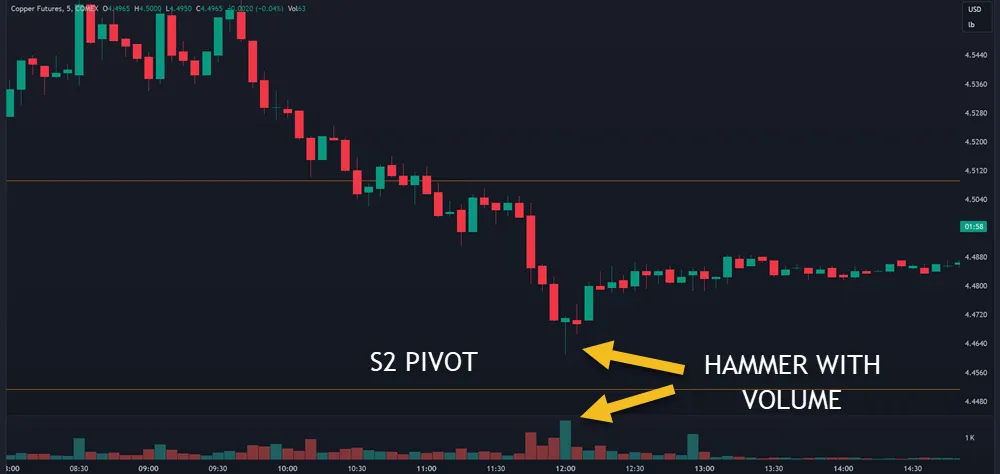
- Assess Volume Magnitude: Check if the volume on the day the hammer forms is significantly higher than in previous sessions. High volume suggests strong market participation and supports the validity of the bullish reversal.
- Compare Volume Trends: Look at volume patterns before and after the hammer appears. Increasing volume following the hammer confirms growing buyer interest and strengthens the likelihood of a sustained upward movement.
- Interpret Volume Consistency: Continuous high volume after the hammer indicates ongoing support for the price movement, improving the reliability of the bullish signal.
Multiple Timeframe Analysis
Analyzing the hammer candlestick pattern across multiple timeframes improves your ability to confirm trend reversals and refine trading decisions.
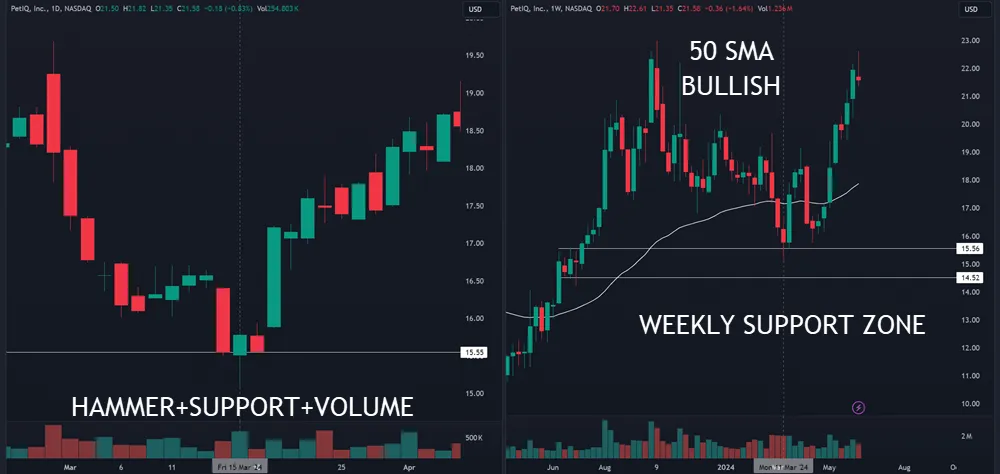
When you use timeframe comparison, you’re not just looking at isolated signals but evaluating how these indicators behave across different periods. This method improves the reliability of the signals you’re considering by providing a broader context.
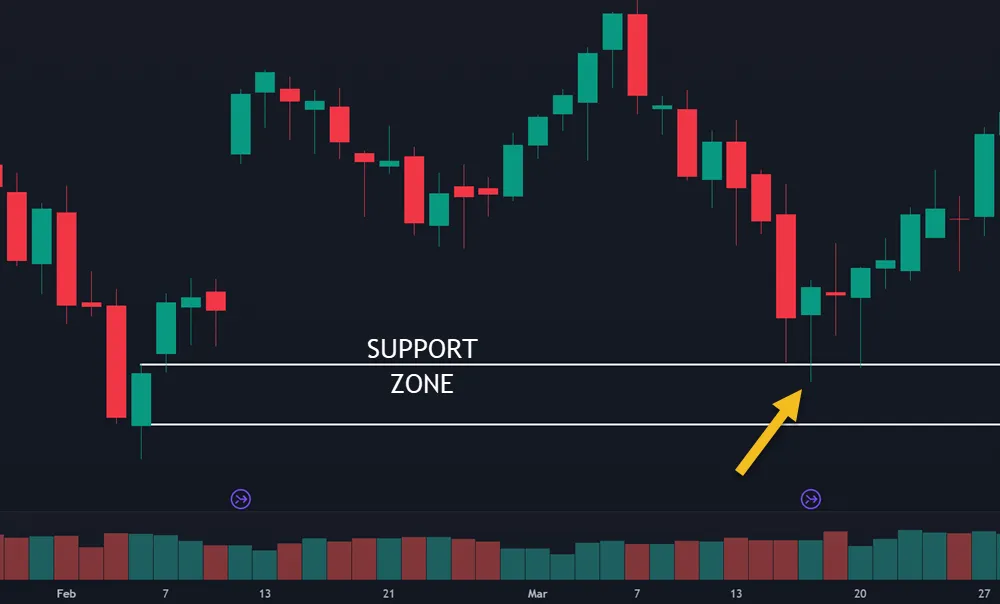
For instance, spotting a hammer pattern on the daily chart might catch your interest, but observing the same pattern on the weekly chart (or price sitting near a support zone) increases your confidence in the trend confirmation.
This dual-layer validation process helps you sift through false signals, ensuring that you’re basing your trades on more reliable data.
Deep Dive The Hammer Pattern
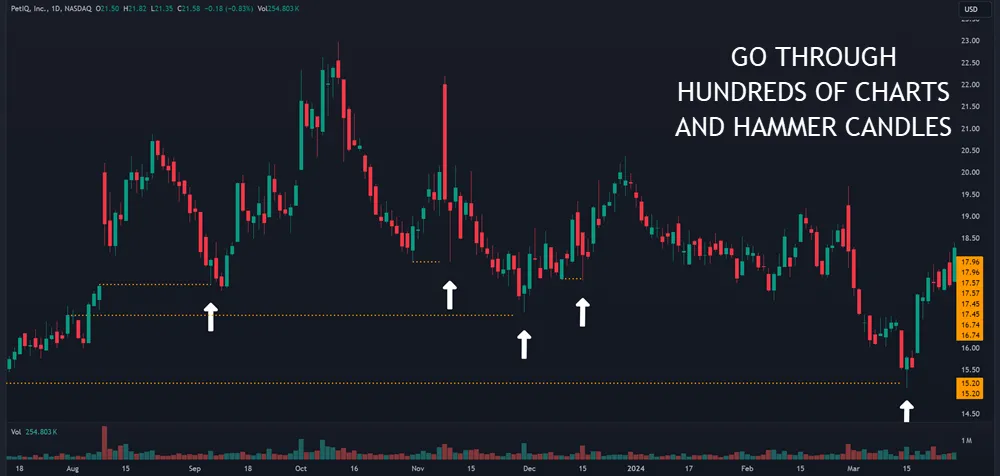
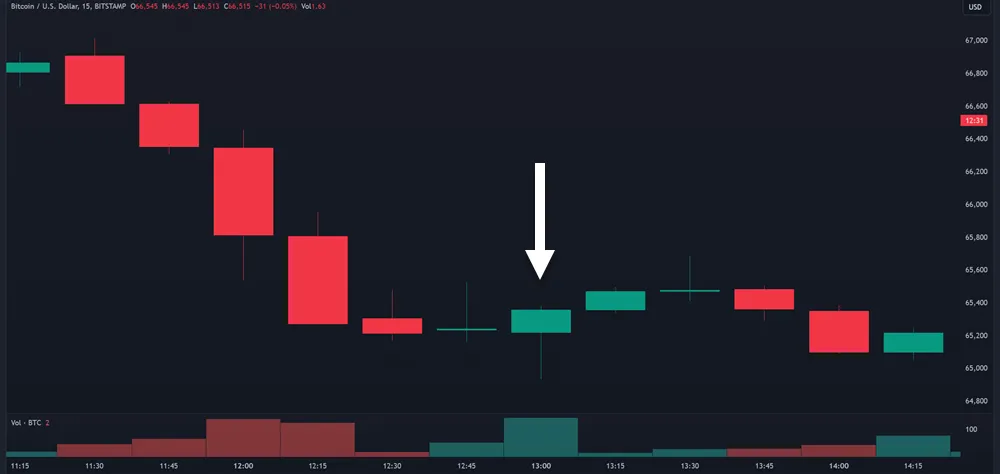
When you examine real trade examples of the hammer candlestick, it’s important to analyze how this pattern manifests in different market conditions.
You’ll observe the hammer pattern in uptrends and downtrends, noting that its appearance and implications can vary significantly.
Pay special attention to failed hammer patterns as well; understanding these can teach you how to see the difference between false signals from genuine reversal opportunities.
Hammer Pattern in Uptrends
You’ll often spot the hammer candlestick pattern as a bullish reversal signal when examining downtrends in an uptrend, particularly near key support levels or Fibonacci retracement points. This is vital for effective trend identification. The anatomy of the hammer—a small body with a long lower wick—suggests that despite the selling pressure, buyers are starting to regain control.
Observing this price action near critical support zones can be a strong indicator of potential reversal.
Here are some analytical steps to incorporate the hammer pattern into your trading:
- Candlestick Anatomy and Price Action: Notice the length of the hammer’s shadow; it should be at least twice the size of the body. This indicates a significant rejection of lower prices, a pivotal aspect of market psychology.
- Trend Identification: Confirm the pattern within the context of an existing uptrend. The presence of the hammer after a pullback not only suggests the continuation of the uptrend but also aids in risk evaluation by pinpointing potential reversal zones.
- Market Psychology and Risk Evaluation: Gauge market sentiment by evaluating the volume during the formation of the hammer. Increased volume provides confirmation, reducing risk and suggesting a stronger buy signal.
Hammer Pattern in Downtrends
While the hammer pattern often emerges in uptrends, it’s equally significant when identified at the bottom of a downtrend, offering a potential shift toward bullish momentum. This candlestick formation is essential for you as a trader to understand and act upon, especially when you’re trying to pinpoint market reversals.
The presence of a hammer pattern in a downtrend doesn’t just suggest a potential reversal; it also reflects a change in market sentiment, indicating that buyers are starting to outweigh sellers.
Your analysis should not stop at recognizing the hammer. Instead, explore technical analysis to confirm this potential shift. The next candle following the hammer is vital for trend confirmation. You’re looking for bullish price action, such as a higher close or a large bullish candle. This confirmation is what differentiates a true reversal signal from a false one.
Here’s a breakdown of the elements to watch in a real trade scenario:
| Element | Importance in Analysis |
|---|---|
| Candlestick Formation | Confirms reversal potential |
| Following Candle | Provides trend confirmation |
| Volume | Indicates strength of buyers |
| Market Sentiment | Shows overall trader sentiment |
| Technical Indicators | Supports the price action |
Failed Hammer Patterns
Identifying a failed hammer pattern is vital as it signals that the expected bullish reversal mightn’t occur, potentially indicating continued bearish momentum.
Here are three critical aspects to ponder when analyzing failed hammer patterns:
- Look for Lack of Confirmation:
A hammer pattern should be followed by a strong bullish candle as confirmation. If this doesn’t happen, and the price continues to drop, it’s a strong indication that the reversal signals weren’t genuine. This lack of confirmation can lead to an extension of the original bearish trend. - Assess the Market Context:
Candlestick patterns don’t exist in a vacuum. Analyze the broader market conditions and sentiment. A failed hammer in a strong downtrend might suggest underlying market weakness that isn’t ready to reverse yet. This context is crucial for accurate interpretation. - Risk Management Strategies:
When a hammer fails, you need to have stop-loss orders in place. Since the anticipated bullish jump didn’t happen, adjusting your exit strategy quickly can minimize losses.
Best Practices and Limitations
When trading with the hammer candlestick pattern, you must be aware of false signals, which can often mislead even advanced traders. Understanding the significance of context is vital; you should analyze the pattern within the broader market conditions to validate it.
Robust risk management strategies, such as setting precise stop-loss orders and backtesting your approach, are essential to protect your investments and optimize performance.
Avoiding False Signals
To minimize the risk of false signals (failed trades), you should always look for confirmation from the subsequent candlestick before committing to a trade based on the hammer pattern. This step is important in distinguishing genuine reversal opportunities from mere noise in the market.
Signal confirmation improves your strategy by ensuring the price action aligns with the hammer’s predictive value.
Here are three strategies to further sharpen your approach:
- Timing Entry: Wait for the next candlestick to close above the hammer’s high. This not only confirms the reversal potential but also reduces the likelihood of entering during a false breakout, optimizing your entry point.
- Noise Reduction: Integrate other technical indicators such as moving averages or the Relative Strength Index (RSI). These tools help filter out the noise and provide a clearer picture of the market’s momentum and trend stability.
- Price Action Analysis: Study the volume accompanying the hammer candlestick. A higher volume indicates stronger interest at the support level, suggesting a more robust foundation for a potential reversal.
Importance of Context
Understanding the context in which a hammer candlestick pattern appears is essential for accurately interpreting its implications for market reversals. You must conduct a thorough contextual analysis to gauge the reversal potential effectively. This involves evaluating the prevailing market environment and trend before committing to a trade based on a hammer pattern.
First, assess the trend leading up to the hammer formation. A genuine hammer appears during a downtrend, signaling the potential exhaustion of selling pressure. However, you shouldn’t rely solely on the appearance of the hammer; explore the trend evaluation to confirm the downtrend’s maturity and the likelihood of reversal. This includes analyzing prior price action to understand the momentum and the strength of the preceding move.
Next, consider the market environment. Are there external factors that could influence price action? It’s essential to integrate these elements into your analysis to avoid misinterpreting the hammer’s signal. The market context can drastically affect the reliability of the pattern. For example, in highly volatile markets, a hammer may not necessarily indicate a strong reversal potential as similar patterns could appear frequently without significant follow-through.
Always make sure that your trading decisions are backed by comprehensive market and trend analysis to maximize the effectiveness of trading hammer candlestick patterns.
Risk Management
Effectively managing risk through setting stop-loss orders and considering position sizing forms the cornerstone of sustainable trading. As you trade volatile markets using the hammer candlestick pattern, it’s important to use a disciplined approach to risk assessment and capital protection.
Here’s how you can refine your risk management strategy to increase your chances for long-term success:
- Set Precise Stop-Loss Orders: Place your stop-loss orders just below the low of the hammer candlestick. This method helps limit potential losses if the market moves against your position. It’s a practical step in protecting your capital while allowing room for the trade to breathe.
- Control Leverage: Use leverage cautiously. High leverage can amplify gains, but it also increases the risk of substantial losses. Leverage management is essential to maintain balance and prevent outsized impacts on your trading account during market fluctuations.
- Maintain Emotional Control: Stick to your trading plan and avoid making decisions based on emotions. Emotional control is important in trading; it helps you adhere to your strategies and decision-making processes, thereby safeguarding you from impulsive actions that can erode your capital.
Frequently Asked Questions
What Is the Most Powerful Reversal Candlestick Pattern?
When you’re identifying the most powerful reversal candlestick pattern, consider the hammer. Its reliability depends on setup criteria, including trend confirmation through following candles and volume analysis.
Engulfing patterns can also play a key role in reinforcing the reversal signal provided by a hammer. By methodically analyzing these elements, you’ll improve your ability to spot and capitalize on potential reversals, making your trading decisions more informed and strategically sound.
What Is the Hammer Reversal Strategy?
The hammer reversal strategy involves spotting a specific candlestick pattern indicating a potential turnaround in a downtrend. You’ll need to master hammer identification, confirm the trend reversal with subsequent price action, and analyze the trading volume for additional validation.
Key to this strategy is determining precise entry points and implementing strict risk management by setting stop-loss orders. This methodical approach guarantees you’re capitalizing on the pattern while safeguarding your investments.
What Is the Psychology Behind the Hammer Candlestick?
The psychology behind the hammer candlestick revolves around a market sentiment shift. When you see this pattern, it often indicates a halt in panic selling, signaling a resurgence in demand.
This pattern can boost investor confidence, suggesting that buyers are regaining control and a bullish momentum may be starting. In essence, the hammer acts as a precursor to potential upward trends, showing a significant turn in market dynamics.
What Does the Reverse Hammer Candlestick Indicate?
The reverse hammer candlestick indicates a shift in market sentiment, suggesting a future bullish trend. It shows price rejection at lower levels as the small body and long upper shadow reveal buyers’ overpowering sellers.
You’ll want to look for a volume increase in the following session as a trend confirmation. Analyzing this pattern helps you understand the market’s direction, preparing you for potentially profitable trading decisions based on this optimistic future outlook.
Conclusion
If you understand the hammer candlestick pattern and its strategic use in trading reversals, remember to integrate other indicators for confirmation before acting. Analyze real trade examples to refine your understanding and application.
While the hammer provides strong signals, don’t overlook its limitations. Always use best practices like setting stop losses and taking profits to manage risks effectively.