
- May 10, 2024
- Posted by: Shane Daly
- Category: Trading Article

Trend lines are a fundamental tool used by traders to analyze market movements. Essentially, these lines connect significant price points, such as the highest and lowest values, to show the market’s direction and momentum. This visualization aids in identifying potential points for buying or selling.

To use trend lines effectively, follow these steps:
- Identify significant price points: Look for the highest highs and lowest lows in the price chart.
- Connect these points using a straight line: This line helps you see the general direction of the market.
- Use this line to guide your trading decisions: A rising trend line suggests buying opportunities when prices dip to the line. Conversely, a falling trend line indicates selling points when prices rise to the line.
You need to draw these lines accurately and consistently.
- Avoid forcing the line to fit the market; not all price points will align perfectly.
- Use at least two major highs or lows to establish a reliable line.
- Regularly update your lines as new price data shows up.
While some traders have unique methods for drawing trend lines, the basic principles apply universally. By mastering this technique, you can enhance your trading strategy and make better trading decisions.
Main Points
- Trend lines connect significant highs or lows to identify market direction and predict future movements.
- They help highlight support and resistance levels, crucial for trading strategies.
- A break in a trend line can signal a potential market reversal or shift in momentum.
- By extending trend lines, traders can project future price actions and set targets.
- Trend lines are validated with increased accuracy when confirmed by high trading volumes and other indicators.
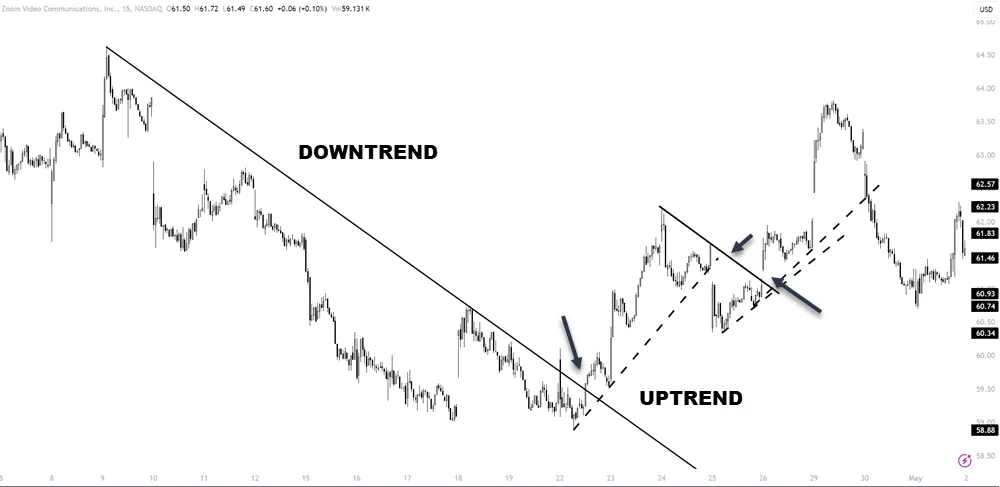
Defining and Constructing Trend Lines
A trend line is a great tool for spotting patterns and analyzing trends.
A trend line is a straight line that connects two or more price points on a chart to represent the general direction of a security’s price movement. Trend lines are used in technical analysis to help traders identify potential levels of support and resistance, as well as to determine the overall trend of a security.

To construct a trend line, you typically need at least two price points to connect. For an uptrend line, you would connect two or more consecutive higher lows. For a downtrend line, you would connect two or more consecutive lower highs. The more price points that can be connected by a trend line, the stronger the trend line is considered to be.
It’s important to ensure that the trend line touches as many price points as possible without violating the overall trend. Trend lines can be used to help traders make decisions about entering or exiting trades based on the direction of the trend.
Trend lines aren’t just for current data; they also help in predicting future trends. By extending the line past your existing data, you can forecast future trends based on past patterns.
Trend Lines In Trading
To make the most of trend lines, follow these steps:
- Identify the Trend: Use trend lines to pinpoint whether the market is moving up, down, or sideways. Draw a line connecting at least two major low points for an uptrend or two major high points for a downtrend.
- Timing Entries and Exits: Enter a trade when the price bounces off the trend line in a trending market, showing continued movement in the trend direction. Exit or consider taking profits when the price breaks the trend line, indicating a potential shift in the trend.
- Spot Support and Resistance: Trend lines also highlight key levels of support in an uptrend and resistance in a downtrend. These are levels where the price might pause or reverse, providing strategic points for setting stop-loss orders or taking profits.
- Anticipate Reversals: Be vigilant for signs of trend line breaks, as these can signal a possible reversal in the market direction. Prepare to adjust your strategy based on these changes.
Identifying the overall trend direction
To use trend lines in trading, first determine if the market is in an uptrend, downtrend, or moving sideways. It’s important to identify the market trend accurately. Start by drawing a trend line. In an uptrend, connect the rising lows. In a downtrend, connect the falling highs. This helps you spot the trend pattern.
Next, ensure your trend line is valid. It should touch at least two significant points. This step confirms that your line is a reliable indicator.
Then, backtest the trend line using past market data. This will help you see if the trend line can predict future movements accurately. Keep an eye on trend line breakouts, as these may indicate a possible change in the trend.
Finally, look for confirmation signals like a surge in trading volume. This supports your analysis and helps confirm that you’re reading the market trends correctly.
Timing your entries
After identifying a trend with trend lines, the next step is to determine precise entry points to optimize your trades. Focus on how the price behaves near these trend lines. For instance, a price retracing to an uptrend line or approaching a downtrend line may indicate a good entry opportunity. Watch for reversal candlestick patterns to confirm these opportunities.

Implement risk management by setting stop-loss orders close to the trend line to limit losses. Additionally, look for trend line breakouts as they often suggest strong movements, providing opportunities for entering trades that either continue the trend or capitalize on a reversal.
Defining key support and resistance levels
Trend lines are helpful tools for spotting key support and resistance levels in trading. These lines reflect the collective mindset of the market and important decision points. A trend line becomes more reliable when it’s tested multiple times; the more it’s touched, the stronger its significance.
Recognizing patterns in trend lines can help you anticipate whether the market will continue in the same direction or reverse.

Additionally, pay close attention to trend line breakouts. When a price breaks through a trend line, it often signals a shift in the market.
Spotting potential trend reversals
When you’re trading, spotting trend reversals early can be profitable. One effective method is to analyze trend line breaks along with other indicators of reversal. Pay attention when a trend line is broken and check the price action closely. If this break is accompanied by specific candlestick patterns, such as dojis or hammers, it could indicate a shift in momentum, suggesting a possible trend reversal.
Here’s a simple table to guide you on what to look for:
| Indicator | Description | Relevance to Trend Reversal |
|---|---|---|
| Trend Line Break | Price moves beyond the line | Primary signal |
| Candlestick | Patterns like doji or hammers | Confirmatory signal |
| Momentum Shift | Changes in volume or velocity | Supporting evidence |
| Price Action | Sudden increase or decrease | Verification signal |
| Early Indications | Combination of the above factors | Holistic view |
Projecting price targets

To effectively use trend lines in trading for projecting future price targets, start by drawing trend lines that connect significant highs and lows on your price chart. When there’s a breakout—a price movement that crosses and closes beyond the trend line—it can signal potential future price movements. Measure the vertical distance between the trend line and the breakout point to estimate the potential price target in the direction of the breakout.
A clear and well-drawn trend line increases the reliability of your analysis. Consistent practice in drawing these lines will lead to better predictions and more informed trading decisions.
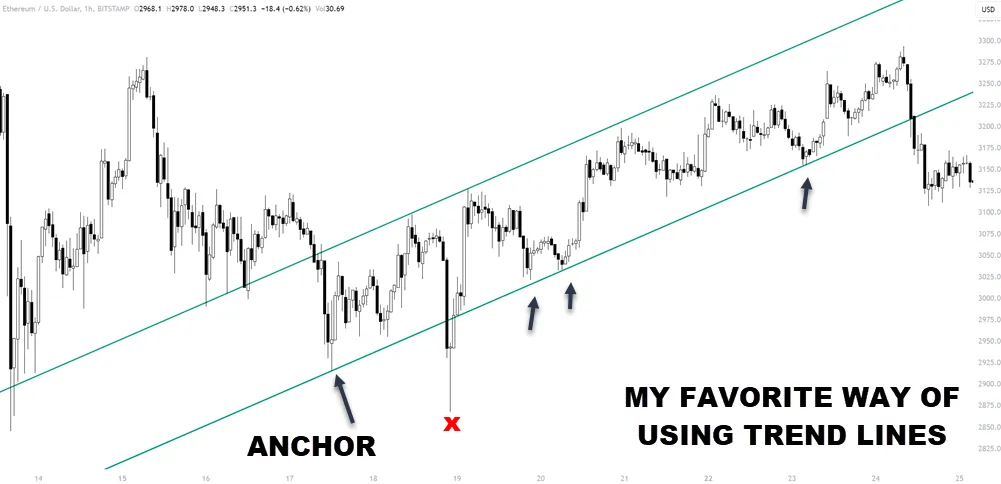
Creating channels
Expanding on the basic idea of trend lines, you can draw another parallel line at the furthest price points opposite the trend line, forming a channel that captures the price action. This approach, known as channel analysis, builds on trend line techniques to pinpoint dynamic support and resistance areas within the channel.

Using these channeling methods helps you spot potential breakout points where the price exceeds the channel limits, indicating either a continuation of the trend or a reversal.
Channel trading strategies primarily hinge on these breakout points. Keep an eye on trend line breakouts, as they often signal major changes in market sentiment. Identifying these key moments can sharpen your trading accuracy, enabling you to make well-timed decisions on when to enter or exit trades based on the channel patterns observed.
Drawing Trend Lines: Technical Analysis
In technical analysis, drawing trend lines effectively is important for improving your trading strategy.
5 Point Practical Guide:
- Connecting Swing Highs/Lows: Basic trend identification.
- Using Multiple Points: Ensures increased validity and reliability.
- Drawing Internal Trend Lines: Offers flexibility in volatile markets.
- Creating Parallel Lines: Helps in setting boundaries and forming channels.
- Combining with Other Tools: Boosts effectiveness and provides confirmatory signals.
Internal Trendlines
These are trendlines that do not use the extreme points but an inside swing at the last higher low for an upsloping trendline and the last lower high for a downtrend line.
Regularly experiment with these methods across different time frames and adjust them with new price data to refine your trend line analysis skills. This approach will keep your techniques current and effective, enhancing your trading decisions.
Pitfalls of Using Trend Lines
When utilizing trend lines in trading, be aware of certain pitfalls and take some important considerations into account. To start, ensure your trend lines are based on objective price action and not influenced by personal biases.
| Pitfall | Consideration |
|---|---|
| Single time frame reliance | Analyze multiple time frames to confirm trends |
| Arbitrary data points | Focus on significant, tested price extremes |
| Ignoring price gaps/tails | Incorporate extremes and gaps in your analysis |
| Preconceived biases | Maintain objectivity in drawing trend lines |
| Extreme trend angles | Use moderate angles to accurately reflect trends |
Be careful with drawing trend lines with extremely steep or flat angles, as these may give unreliable signals about the sustainability of price movements.
Frequently Asked Questions
Can Trend Lines Predict Stock Prices Accurately?
Trend lines can’t predict stock prices with complete accuracy due to statistical limitations, varying price volatility, and inconsistent chart patterns.
Are Trend Lines Effective in All Market Conditions?
Trend lines aren’t always effective in all market conditions. Market volatility, varying time frames, asset liquidity, and historical data greatly impact their reliability.
How Do Algorithms Utilize Trend Lines in Trading?
Algorithms integrate trend lines by identifying patterns, enhancing execution speed, and optimizing risk management. They analyze historical data to predict future movements, ensuring you’re leveraging precise, data-driven strategies for effective trading decisions.
What Impact Do Economic Events Have on Trend Lines?
Economic events like policy shifts and employment data often trigger market reactions. You’ll see trend lines adjust as inflation effects become clear, illustrating how these events impact overall market dynamics and investor behavior.
Are Trend Lines Applicable to Non-Financial Data Analysis?
Yes, you can apply trend lines to non-financial data like population growth, climate modeling, health trends, educational progress, and technological adoption to analyze patterns and predict future changes precisely and effectively.
Conclusion
Trend lines are vital tools in technical analysis. By accurately drawing and interpreting these lines, you can identify trends, support, and resistance, and pinpoint potential reversals.
It’s important to avoid letting personal biases affect where you place your lines. Look for consistency in your methods and back up your strategies with historical data to improve the accuracy and dependability of your trading decisions.