- February 26, 2025
- Posted by: Shane Daly
- Category: Trading Article
The Three Inside Up candlestick pattern is a bullish reversal signal consisting of three candles: a long bearish candle, followed by a smaller bullish candle contained within the first (body), and a third bullish candle that closes above the first candle’s closing price. This pattern occurs during downtrends with a 2.22% frequency in the S&P500, suggesting a potential trend change. Traders use stop-loss orders below the first candle’s low to manage risk.
Quick Overview
- Three Inside Up is a bullish reversal pattern consisting of three candlesticks that signal a potential change from downtrend to uptrend.
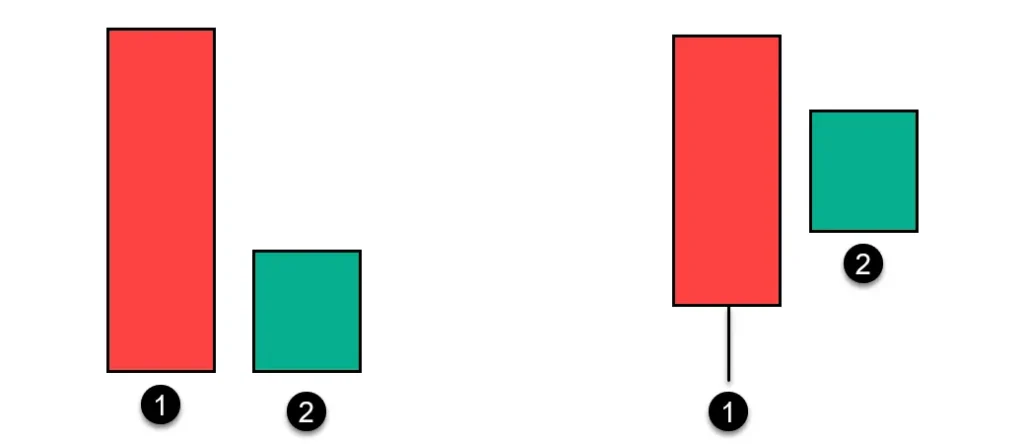
- The pattern forms with a long bearish candle, followed by a smaller bullish candle inside it, and a third bullish closing candle.
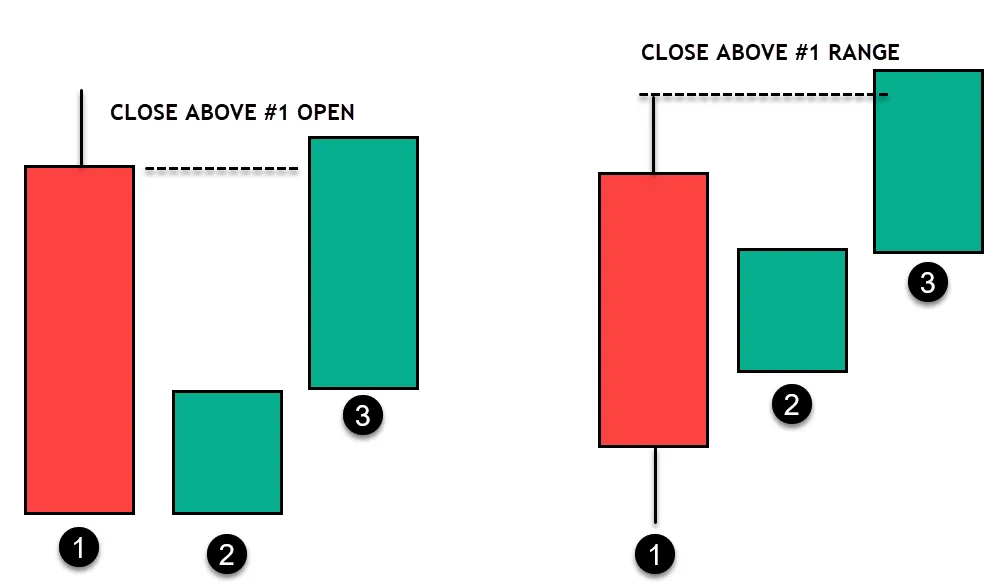
- The third candlestick must open above the second candle’s midpoint and close above the high of the first candle.
- Statistical analysis shows the pattern appears in 2.22% of cases in the S&P500, making it a significant trading signal.
- Traders typically place stop-loss orders below the first candlestick’s low and aim for a minimum 1:2 risk-reward ratio.

Identifying Pattern Formation in Market Trends
Successful identification of a Three Inside Up pattern requires traders to observe specific candlestick sequences during downward market trends. Traders analyze trend data spanning 5-10 candlestick formations to confirm the pattern’s validity, particularly focusing on the first bearish candle‘s size compared to surrounding candlesticks.
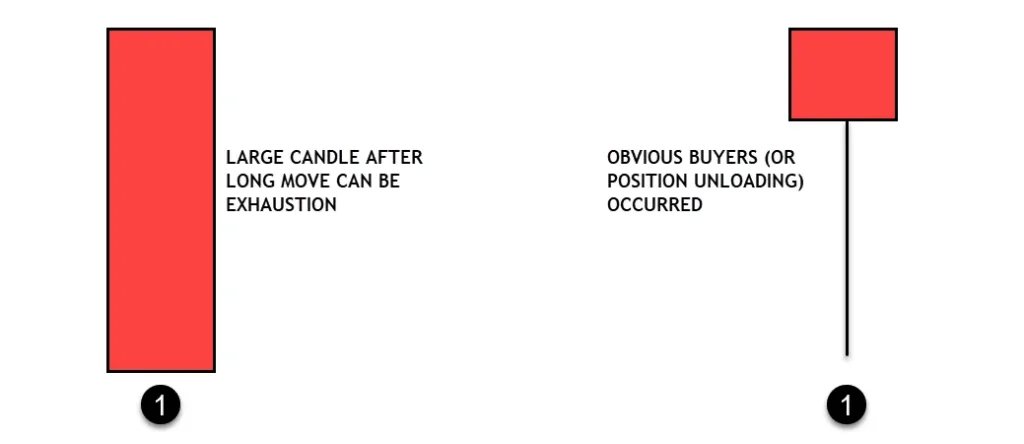
The pattern formation begins with a large bearish candle followed by a smaller bullish candle contained within its range. The final bullish candle must open above the midpoint of the first candle and achieve a closing price higher than its upper wick.
Statistical analysis shows this pattern appears in 2.22% of S&P500 trading scenarios over two decades, making it a significant signal for trading strategies. When properly identified during a downtrend, this pattern often indicates a potential bullish reversal.
For improved trading strategy effectiveness, traders often look for confirmation by volume and other technical analysis tools. This three inside up pattern’s clear structure makes it particularly useful for both novice and experienced traders monitoring market dynamics.
Trading Strategies and Entry Points
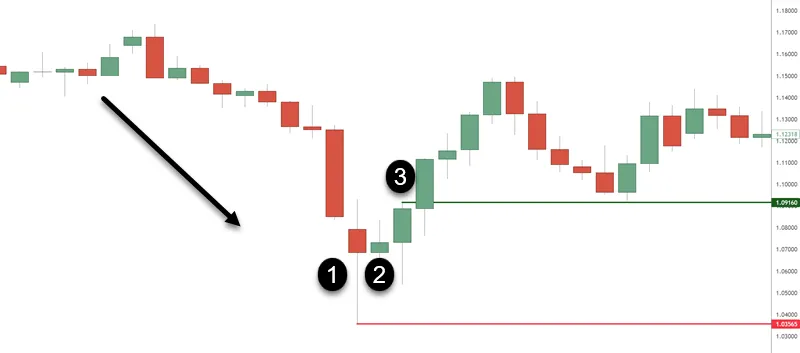
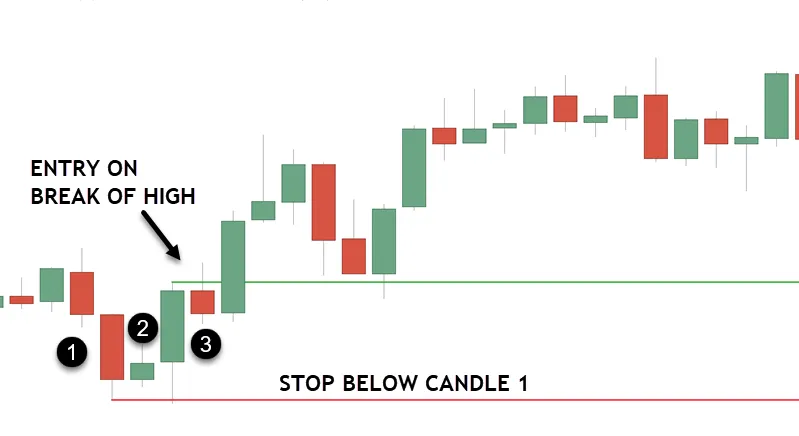
Implementing effective trading strategies for the Three Inside Up pattern requires attention to entry points and confirmation signals. Traders should wait for the third candle to close above the first bearish candlestick’s upper wick before entering long positions. This confirmation helps ensure a valid bullish reversal is taking place (some traders ignore the range and only focus on the body).
Traders that are more experienced in reading individual candlesticks can look for a closing price above the first candlesticks closing price (look at the first image in the article)
To manage risk effectively, traders should place stop-loss orders below the low of the first candlestick. The 20 SMA crossover provides an additional layer of trend confirmation for more reliable trade setups. Market conditions and trading volume play important roles in determining the pattern’s reliability. Higher trading volume during the formation suggests stronger conviction behind the price movement.
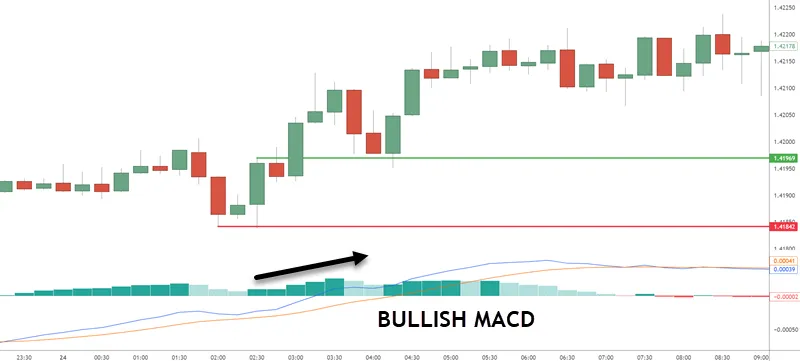
For additional confirmation, traders can use technical indicators like MACD or RSI to validate the bullish reversal. Considering Fibonacci retracement levels helps identify potential resistance areas that could affect the trade’s outcome.
Key price movements often occur during the primary trading session when market activity and liquidity are at their highest levels.
Risk Management and Position Sizing
Sound risk management forms the cornerstone of successful trading with the Three Inside Up pattern. Traders should place a stop-loss order below the low of the first bearish candle to protect against potential losses if the trend reversal fails.
Position sizing plays a important role, with traders limiting their exposure to 1-2% of their total trading capital per trade. The asset’s volatility should guide position sizing decisions, as more volatile markets require smaller positions to account for wider price swings.
Trading with risk capital only ensures protection against financial jeopardy while pursuing market opportunities. Price action readings can provide additional confirmation for position sizing decisions.
A minimum risk-reward ratio of 1:2 helps ensure profitable outcomes when the pattern succeeds. Traders should also pay attention to trading volumes during pattern confirmation, as higher volumes typically signal stronger reversal potential and increase the likelihood of a successful trade.
Using the Average True Range indicator can help determine optimal stop-loss placement based on the market’s current volatility levels.

Pattern Validation Methods and Success Rates
To validate the Three Inside Up pattern effectively, traders must consider both statistical data and real-time market conditions.
Analysis of the S&P500 reveals an occurrence rate of 2.22% over two decades, with 14,197 documented instances. This candlestick pattern’s success rates vary across different securities, as demonstrated through comprehensive backtesting.
Pattern validation becomes more reliable when accompanied by strong trading volume during confirmation. Round number levels often create significant psychological barriers that can affect pattern reliability.
Strong trading volume during pattern confirmation strengthens validation, providing traders with a more reliable signal for potential market moves.
Studies show that the pattern appears approximately 157.5 times within typical trading periods. Traders can bolster their confidence in potential trend reversals by looking for additional confirmatory signals, such as breaks in support zones or trendlines.
Understanding these validation methods helps traders make more informed decisions, as the pattern’s effectiveness varies depending on market conditions and specific securities being traded.
Maintaining emotional detachment from individual trade outcomes helps ensure consistent application of pattern validation criteria.
Implementing stop loss strategies based on Average True Range can help protect against potential losses when trading this pattern.
Common Variations and Related Candlestick Patterns
Understanding the Three Inside Up pattern becomes clearer when examining its common variations and related formations in the candlestick family. The pattern shares key characteristics with several other bullish trend reversal signals, particularly the Bullish Engulfing pattern, though it uses three candles instead of two for confirmation.
| Pattern Name | Structure | Characteristics | Confirmation |
|---|---|---|---|
| Morning Star | Three candles: a bearish candle, a small-bodied candle, and a bullish candle. | Indicates a potential reversal from bearish to bullish. | Requires confirmation from the third candle. |
| Bullish Harami | Two candles: a large bearish candle followed by a smaller bullish candle. | Suggests a reversal in a bearish trend; the small candle is contained within the large one. | Lacks a third confirming candle. |
| Three Inside Up | Three candles: a bearish candle, a smaller bullish candle inside the bearish one, followed by a larger bullish candle. | Indicates a strong bullish reversal; the third candle confirms the reversal. | The third candle confirms the bullish momentum. |
| Three White Soldiers | Three consecutive bullish candles. | Confirms bullish momentum and strengthens the bullish reversal signal. | Complements the Three Inside Up pattern. |
Successful traders analyze higher highs and lows to confirm bullish trends when these patterns emerge.
Your Questions Answered
What Does the Three Inside up Candlestick Pattern Mean?
A bullish reversal pattern in candlestick analysis reveals shifting market psychology and investor sentiment, indicating potential trend confirmation through price action signals, often used alongside technical indicators for trading strategies.
What Is the 3 Candlestick Pattern?
A three-candlestick pattern combines price action signals from three consecutive trading periods, revealing market psychology and investor sentiment through candlestick analysis, helping traders identify potential trend reversals and manage risk.
What Is the Rarest Candlestick Pattern?
The Three Outside Up pattern is considered the rarest candlestick formation, occurring in less than 1% of trading scenarios, yet maintaining high reliability for trend confirmation in technical price action analysis.