- September 20, 2020
- Posted by: CoachMike
- Categories: Options Trading, Trading Article
There is no doubt about it, Apple and it’s stock has been the undisputed market leader over the last few years. It is such a big part of the S&P 500 and the Nasdaq, that it drives most market movement each week.
As goes Apple so goes the rest of the market.
How We Approach Apple Stock In Trading
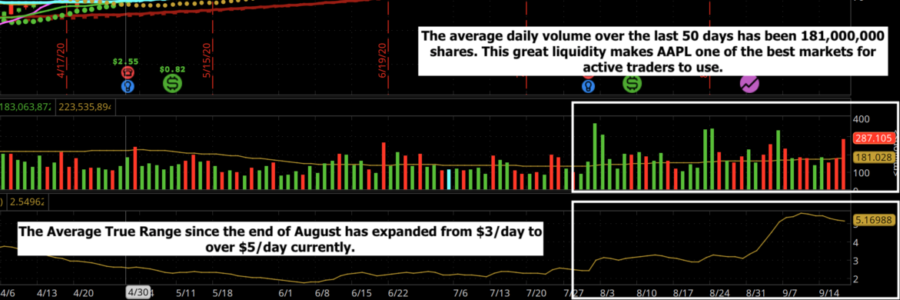
Apple is now almost a $2 trillion-dollar company but more importantly it’s the most active traded stock on a daily basis. The average volume over the last 50 days has been 180 million shares. This makes it a great product for active traders to use.
Apple also just did a 4:1 stock split at the end of August, which makes it even easier for retail traders to use since the stock and options now trade at lower prices. The stock split has also led to higher volume the last few weeks both in the stock and the options which gives Apple some of the tightest markets to trade.
The Average True Range on Apple since the end of August has gone from around $3/day to over $5/day. This range opens the door to many different options strategies including weekly and monthly options as well as long calls/puts, debit spreads, and credit spreads.
Trading Apple Via Options
The Implied Volatility in the options has moved higher over the last 3 weeks. We track these levels using the Implied Volatility Percentile tool inside of the Thinkorswim platform.
That level is currently at the 40th Percentile.
Anytime we see this level over 30 it means the options are more expensive which has us looking to using more credit spreads.

Apple also has earnings out Oct 29 after the market closes. This has me looking for shorter duration trades that will complete before the earnings release. My preferred expiration cycle is the October monthly cycle that currently has 26 days left to expiration.
Chart Levels
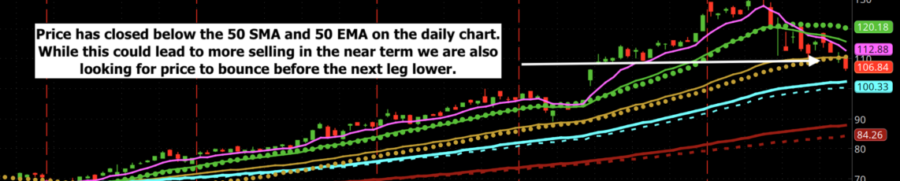
Apple just broke down through both the 50 Simple Moving Average as well as the 50 Exponential Moving Average on the Daily chart. While this has provided a nice trading opportunity on the downside, now is not the time to initiate new bearish positions.
We prefer to look for a bounce higher in the near term before the next leg lower.
Looking at the 195-minute chart, AAPL has also reached a 1-2 Standard Deviation Channel move on the downside. This is shown by the Yellow bars with our Pulse indicator on the chart below. The yellow bars will plot in the histogram when price closes between the 1-2 Standard Deviation channels.
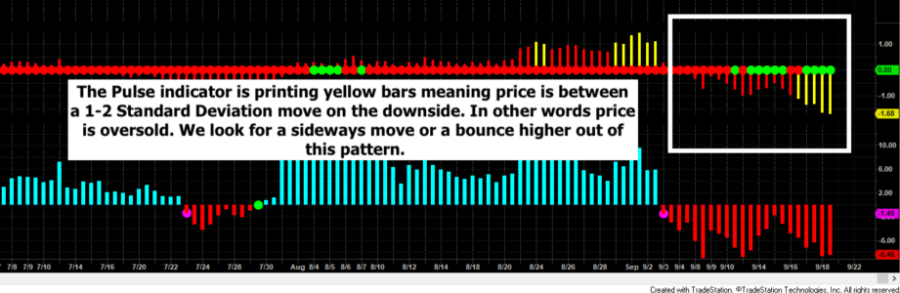
When price reaches these levels on the downside it represents an oversold condition in the near term. This pattern will typically lead to a period of consolidation or even a reversal in the other direction. We typically like to play these moves with a credit spread looking for a sideways move or a bounce higher.
The last few months every selloff has been a buy the dip opportunity. The bulls are not going to give it up easily. As a result, there is a good chance of a market bounce next week.
Potential Trade Example In Apple
Let’s take a look at a potential trade opportunity going into next week.
Please note this is not a recommendation to take the trade. We are going to use this trade as an example that shows how we take the chart analysis to actually structuring the trade.
We will be looking at selling a Put Credit Spread in anticipation of Apple finding support next week bouncing higher. For this trade we will be looking at using the October monthly options with 26 days left to expiration.
We will be using the out of the money put options.
To structure the trade, we will be selling the 102.5/100 put spread. In other words, we are selling the 102.5 put to open the trade and buying the 100 put at the same time to make sure we are in a risk defined trade.
Using the closing options prices from Friday afternoon we can collect $.89 or $89 per spread.

The $.89 that we collect to put the trade on is our maximum profit potential on the trade.
Our max risk on the trade is $1.61 or $161 per spread. The max risk is calculated by taking the $2.5 difference between the 102.5 and 100 strike prices of the options we are trading and the $.89 that we are collecting to place the trade.
We can be dead wrong on the trade and not lose more than $161 per spread.
5 Ways To Make Money On Our Apple Trade
We could make money on the trade if Apple moves up, down, or sideways as long as the stock price closes above $101.61. We also make money from time decay adding up each day and if volatility decreases. This will give us 5 ways of making money on the trade.
The beauty of having 5 ways of making money on the trade is it gives us a much more forgiving trade. We don’t need a big directional move to make money. The stock could chop back and forth, and we are still ok as long as the stock price stays above $101.61.
The profit goal on this trade is when we can buy the spread back to close out of the trade and keep between 50-75% of premium collected on the trade.
In this example, we would be collecting $.89 to put on the trade so our target zone is when we can buy the spread back for between $.22-$.44. That would allow us to keep 50-75% of the max profit potential on the trade.
We prefer to close the trade early with a partial profit so we can avoid having to hold to expiration when the directional risk picks up. It also frees up the capital for a new trade at that point.
Big Picture
Heading into fall elections, we expect markets to remain very active. This means big moves back and forth. Controlling risk and staying diversified is crucial over the next few months. There will be incredible opportunity as long as we are open to keeping the risk small and using a wide range of options strategies.
Apple is a key component of the market and is one of the best stocks to use to take advantage of the market volatility.