
- May 27, 2024
- Posted by: Shane Daly
- Categories: Trading Article, Trading Indicators

A moving average crossover strategy is a trading method where you track two moving averages: a short-term moving average and a long-term one. You’d look for the moment the short-term average crosses over the long-term average, signaling potential trend shifts.
This cross can point to buying opportunities when the short-term average cross is above the long-term average, or selling signals when it dips below the long-term average. Choosing the right time frames and understanding the market context (trend or range) is important to avoid as many failed trades as possible.
By combining this strategy with risk management techniques, you set yourself up to find great trading opportunities that can increase your account size.
FREE REPORT: THE #1 Breakout Trading Plan…
Main Points
- The Moving Average Crossover Strategy uses two moving averages to signal potential market shifts.
- It provides entry and exit signals through the cross of the averages. Not the best way to trade them.
- Effective in identifying market trends, simplifying data, and grasping market sentiments.
- Drawbacks include the strategy’s lagging nature and susceptibility to false signals during volatile market conditions.
- Strategy optimization can be achieved by incorporating other indicators like RSI, MACD, and Bollinger Bands.
Introduction to Moving Average Crossover Strategy
As you start to experiment with a Moving Average Crossover Strategy, you’ll first need to understand what moving averages are. These are indicators that smooth out price data over a specified period to help identify the trend direction and trend strength.
What are Moving Averages?
Averages smooth out price data to reveal market trends and potential turning points. You’ll find them essential in your trading toolbox, helping you to interpret and act on market data more efficiently.
Here are the main types you’ll encounter:
- The SMA is calculated by averaging the closing prices of an instrument over a specified number of days. It’s straightforward and gives equal weight to all prices in the period.
- The EMA gives more weight to recent prices, reacting quicker to price changes. This makes it particularly useful for those looking to catch trends early.
- The WMA also prioritizes recent prices but does so linearly through a weighting factor, providing a unique perspective on price movements.
By identifying where the price is to these averages, you can see the strength and direction of a trend, making your trading decisions more grounded and less susceptible to the whims of market volatility.
Understanding Crossovers
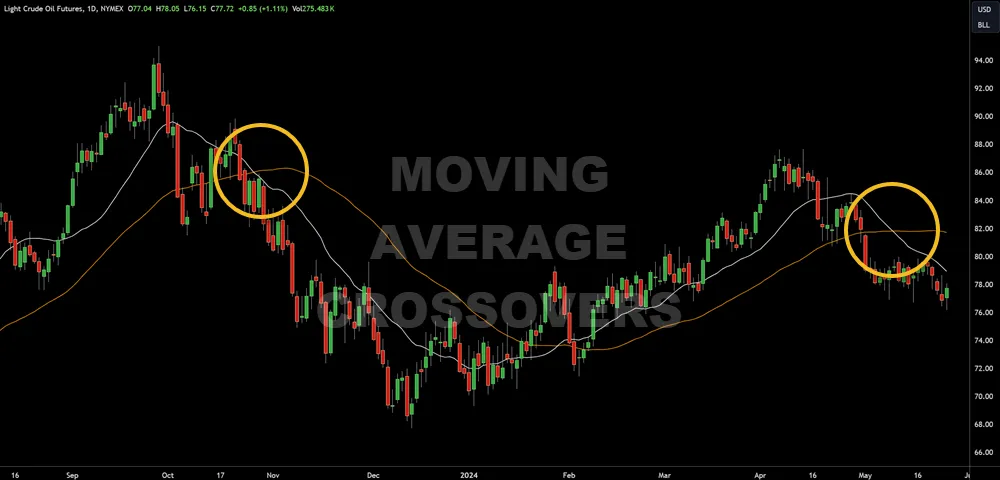
To understand any moving average crossover strategy, you’ll first need to understand how different moving averages interact on a chart. At its core, this strategy involves two moving averages—a shorter period and a longer period. When these two lines cross, they indicate potential trend shifts that you can use to find a trading opportunity.
Here’s how it works: imagine you’re looking at a chart, and you plot both a 50-day and a 200-day moving average. The 50-day line reacts faster to price changes because it considers fewer days. Conversely, the 200-day line moves slower, providing a smoother overall trend line.
When the 50-day moving average crosses above the 200-day moving average, it’s a signal that could suggest a bullish trend is starting. This is often called a ‘golden cross.’ On the flip side, if the 50-day drops below the 200-day, it might indicate a bearish trend, known as a ‘death cross.’
These signals are important because they help you predict if it’s time to buy or sell. Remember, the moving average crossover strategy isn’t foolproof; it’s just one tool among many. You’ll need to take into account other factors and signals to make the most of the signals these provide.
Implementing the Moving Average Crossover Strategy
You’ll need to start by choosing the right moving averages that suit your trading style and goals, which will be the foundation of generating reliable entry and exit signals.
Choosing the Right Moving Averages
Selecting the appropriate moving averages is essential when implementing the moving average crossover strategy.
When you’re setting up your strategy, consider using a double crossover involving two moving averages (like a short-term SMA and a long-term EMA) for more confirmation on trend changes.
For an even deeper analysis, a triple crossover using three different lengths ( 3 EMA crossover ) can provide additional layers of trend confirmation, though it requires careful understanding to avoid complexity in interpreting the setups.
Make sure to match your trading style and risk tolerance.
Entry and Exit Signals
Once you’ve chosen your moving averages, you’ll need to understand how to take the entry and exit signals they provide. When the shorter moving average crosses above the longer one, it’s a buy signal, indicating a potential c.
Conversely, a sell signal is when the shorter moving average crosses below the longer one, suggesting a downtrend.
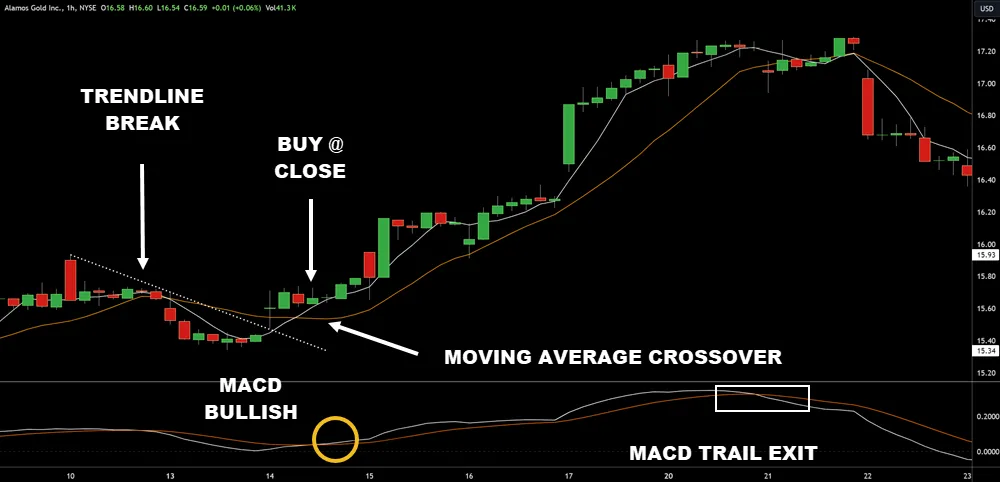
However, it’s critical not to rush into a trade. You’ll want a confirmation of the trend before you act. This could be another close of the price above the crossover for a buy signal, or below it for a sell signal. It helps to minimize the risk of false signals, especially in volatile markets.
Different timeframes can impact the effectiveness of these signals. Using daily or weekly charts smooths out some of the market ‘noise’ and provides a clearer view of the trend compared to hourly charts.
Backtesting your chosen timeframes with historical data is essential. This process will show how often the crossovers led to profitable trades in the past, which helps in understanding the strategy’s potential effectiveness.
Risk Management and Position Sizing
Implementing effective risk management and precise position sizing is important when using the moving average crossover strategy. To get more success in your crossover trades, you’ve got to nail down these aspects.
Here’s a quick breakdown:
| Aspect | Description | Why It Matters |
|---|---|---|
| Stop-Loss Levels | Set using technical levels or a fixed percentage of your balance | Protects capital, limits losses |
| Position Sizing | Calculated based on account balance and risk tolerance | Prevents overexposure, optimizes trades |
| Risk-Reward Ratio | Target ratio where potential profit is twice the potential loss | Ensures more gain than risk on trades |
When you’re combining technical indicators, backtesting, and forward testing become essential. They allow you to refine your strategy and anticipate how it might perform in real-market conditions. Handle these steps carefully to boost your confidence and effectiveness in trade execution.
Trading Strategy Using 5-bar and 13-bar Moving Averages
Most people who enter trading are not looking for position trades but would like quicker outcomes for their trades. This crossover strategy is going to use shorter periods for the averages as well as for the charts.
This strategy can be applied to any financial instrument, including stocks, forex, cryptocurrency, options, and commodities. It involves using the 5-bar and 13-bar moving averages to identify entry and exit points, with an additional indicator to confirm signals and improve accuracy.
Indicators:
- 5-bar Simple Moving Average (SMA)
- 13-bar Simple Moving Average (SMA)
- Relative Strength Index (RSI) with a 14-period setting
Time Frame:
- This strategy can be used on various time frames, but it is particularly effective on intraday charts such as 5-minute or 15-minute charts for day trading. It can also be adapted to longer time frames like hourly charts for swing trading.
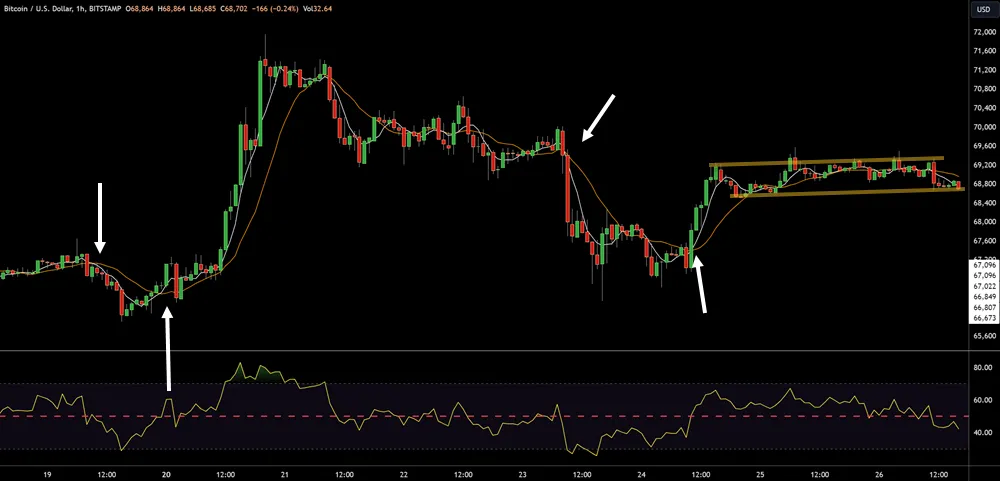
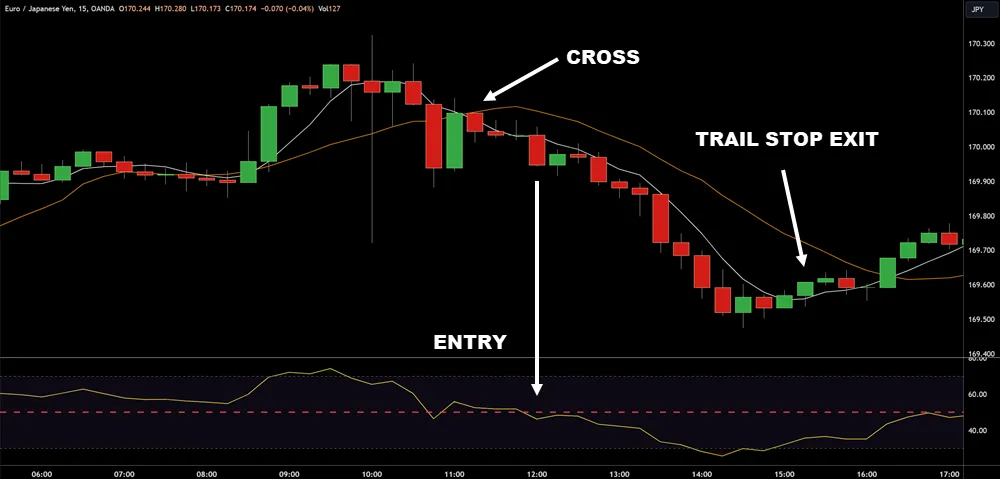
Entry Rules:
- Buy Signal:
- The 5-bar SMA crosses above the 13-bar SMA.
- The RSI is above 50, indicating bullish momentum.
- Buy at the close of the bar.
- Optional: Look for a bullish candlestick pattern (e.g., a hammer or bullish engulfing) to confirm the entry.
- Sell Signal:
- The 5-bar SMA crosses below the 13-bar SMA.
- The RSI is below 50, indicating bearish momentum.
- Sell at the close of the bar.
- Optional: Look for a bearish candlestick pattern (e.g., a shooting star or bearish engulfing) to confirm the entry.
Exit Rules:
- Take Profit:
- Set a predefined profit target based on the average true range (ATR), ratio of your risk, or a fixed percentage (e.g., 1-2%).
- Alternatively, use a trailing stop to lock in profits as the price moves in your favor.
- Stop Loss:
- Place a stop loss below the recent swing low for buy trades or above the recent swing high for sell trades.
- Alternatively, use the ATR to set a dynamic stop loss.
Example Trade Setup:
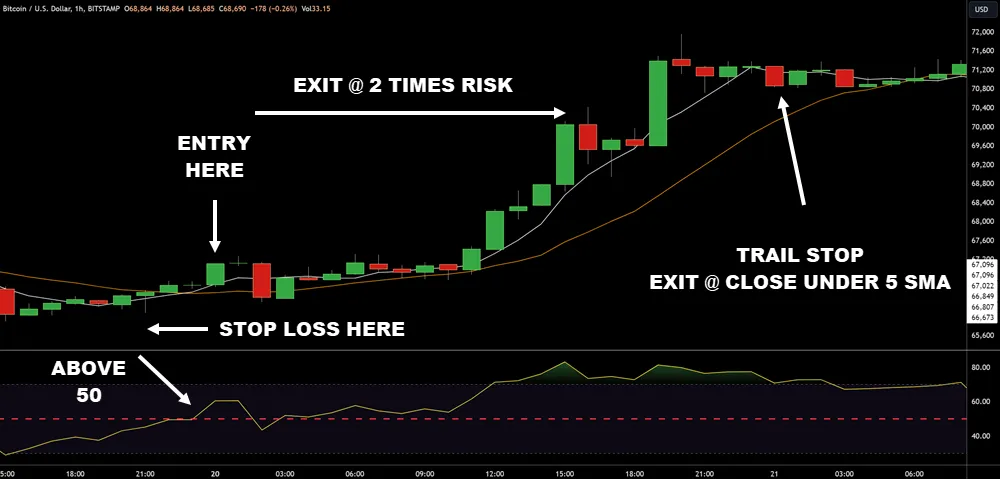
- Buy Trade:
- The 5-bar SMA crosses above the 13-bar SMA on a 5-minute chart.
- The RSI is above 50, confirming bullish momentum.
- A strong candle forms, providing additional confirmation.
- Enter the trade at the close of the bullish candlestick.
- Set a stop loss below the recent swing low.
- Set a take profit target based on the ATR, 2x risk, or use a trailing stop.
- Sell Trade:
- The 5-bar SMA crosses below the 13-bar SMA on a 5-minute chart.
- The RSI is below 50, confirming bearish momentum.
- A strong bearish candle forms, providing additional confirmation.
- Enter the trade at the close of the bearish candlestick.
- Set a stop loss above the recent swing high.
- Set a take profit target based on the ATR or use a trailing stop.
Additional Tips
- Backtesting: Before using this strategy in live trading, backtest it on historical data to ensure its effectiveness.
- Risk Management: Always use proper risk management techniques, such as risking only a small percentage of your trading capital on each trade.
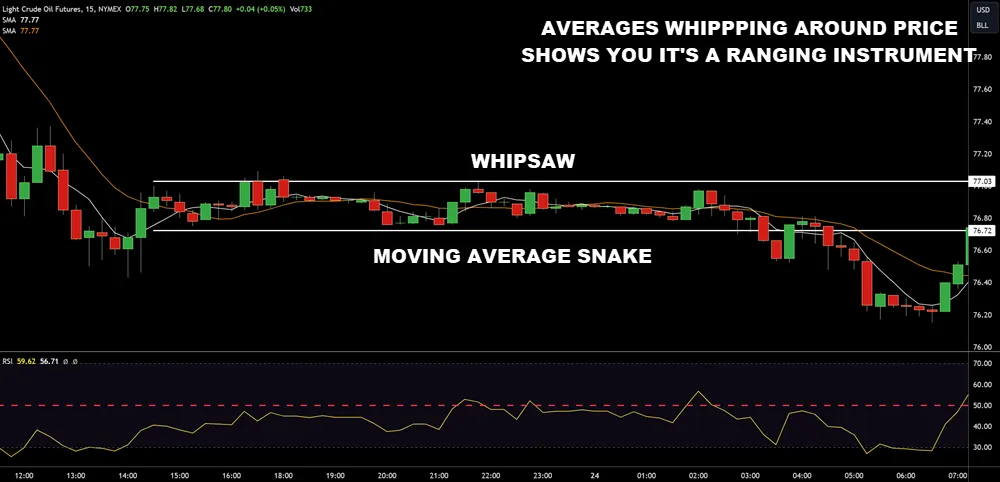
- Market Conditions: Be aware of the overall market conditions. This strategy works best in trending markets and may produce false signals in choppy or sideways markets.
- Use Pullbacks: After the cross of the average, look for the price to pull back into the area around the moving averages
By combining the 5-bar and 13-bar moving averages with the RSI and price action patterns, this strategy provides a robust framework for identifying high-probability trading opportunities across various financial instruments.
Advantages and Limitations of the Strategy
As you investigate the Moving Average Crossover Strategy, you’ll find that it has both strong advantages and obvious limitations. You can benefit from its ability to indicate potential entry and exit points in the market, assisting you in making trading choices based on actual data.
However, you should also be mindful of the risks, including the potential of producing false signals during volatile market conditions.
Pros of Moving Average Crossovers
Why should you consider using moving average crossovers in your trading strategy?
This technique involves observing the interaction between a short-term moving average and a long-term moving average. It’s a cornerstone of the moving average crossover strategy, providing clear signals for potential market entries and exits.
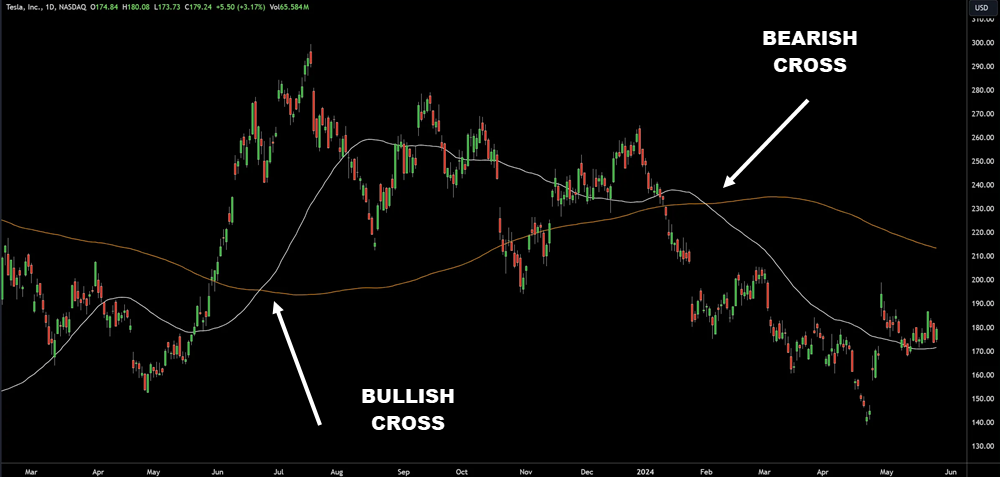
One key advantage is the identification of significant market trends through ‘golden crosses‘ and ‘death crosses.’ A golden cross occurs when the short-term moving average crosses above the long-term moving average, signaling a possible bullish market trend.
Conversely, a death cross happens when the short-term moving average crosses below the long-term moving average, indicating a potential bearish downturn. These indicators help you grasp market sentiments and can guide your trading decisions effectively.
Some traders will use the crossovers as information only in terms of direction and use other methods to trade.
Using moving average crossovers simplifies the complexity of market data. It filters out the “noise” from random price fluctuations, offering a clearer view of the market trends. This can be especially helpful if you’re not a seasoned trader but still want to participate in the market actively.
Drawbacks and Risks
While moving average crossovers can streamline market analysis and improve decision-making, they also come with inherent risks and limitations that you should consider.
- These indicators are inherently lagging. This means they’re based on past prices and mightn’t predict future market movements accurately. You could be making trading decisions based on outdated information, missing out on early signs of market reversals or new trends.
- You’ll face challenges with whipsaw effects in choppy markets. Here’s where the price oscillates quickly and often unpredictably, causing the moving averages to cross back and forth, generating multiple trading signals that could lead to significant losses if not managed properly.
Here’s a brief list to keep in mind about the limitations and risks:
- Lagging nature: Moving averages rely on historical data, which may not always be indicative of future trends.
- Whipsaw in choppy markets: Frequent crosses can lead to confusion and poor trading decisions.
- Analyzing false signals and drawdowns: Identifying and differentiating false signals from valid ones can be challenging, leading to potential drawdowns.
- Adaptive moving average crossover: While more responsive to price changes, they still don’t guarantee success and require careful analysis and risk management.
Optimizing the Moving Average Crossover Strategy
To optimize your moving average crossover strategy, you’ll need to take into account a few critical adjustments.
First, you can improve accuracy by combining it with other technical indicators, which helps validate the signals you’re tracking.
Next, adapt the strategy to different market conditions to guarantee it remains effective across various trading environments.
Combining with Other Technical Indicators
Integrating multiple technical indicators can significantly enhance the effectiveness of your moving average crossover strategy. By combining tools like the Relative Strength Index (RSI), Moving Average Convergence Divergence (MACD), Bollinger Bands, and the Stochastic Oscillator, you’ll be able to confirm and refine your trading signals, improving your ability to navigate trending markets effectively.
Here’s how you can optimize your strategy:
- Incorporate the RSI to validate the strength of a trend following a moving average crossover. An RSI value above 50 typically confirms a bullish trend.
- Use the MACD for additional confirmation of trading signals. A MACD line crossing above the signal line suggests a strong bullish trend.
- Apply Bollinger Bands to assess market volatility. A price move beyond the upper Bollinger Band can indicate a strong upward trend.
- Check the Stochastic Oscillator for overbought or oversold conditions. This can help you avoid failed signals during market extremes.
Adapting to Different Market Conditions
Adapting to market conditions means tweaking your indicators to better respond to the market’s behavior. You’ll start by choosing the right type of moving average based on the market’s volatility.
When the market is trending steadily, a simple moving average (SMA) might be your best bet. It smooths out price data, providing a clear view of the trend over a longer period.
However, if the market is more volatile, you might want to switch to an exponential moving average (EMA), which gives more weight to recent prices and reacts faster to price changes.
For a fine-tuned approach, consider using a weighted moving average (WMA), which allows you to assign specific weights to certain periods, emphasizing what you believe to be the most critical points.
Backtesting and Forward Testing
Before implementing your moving average crossover strategy in live trading, you should backtest and forward-test it to validate its effectiveness. Backtesting allows you to see how your strategy would have performed in the past using historical data.
It’s like a rehearsal for your trading, giving you the chance to refine your approach without risking real money.
Forward testing, on the other hand, involves testing your strategy in real time with live data but not necessarily with real money. This phase is important as it helps you understand how your strategy performs under current market conditions.
Here are some key steps to optimize your backtesting and forward testing:
- Select Appropriate Data: Make sure you’re using quality data that reflects the market conditions your strategy will face.
- Choose the Right Indicators: Incorporate a mix of simple moving averages (SMA), exponential moving averages (EMA), and weighted moving averages (WMA) to capture different market dynamics.
- Adjust for Overfitting: Regularly refine your strategy to avoid overfitting to historical data, which can lead to misleading results.
- Test Different Scenarios: Use a variety of market conditions to test your strategy’s adaptability and robustness.
Advanced Concepts and Tips for Success
As you advance in using the Moving Average Crossover Strategy, expand your toolkit by integrating multiple time frame analyses to improve your decision-making process.
You’ll also benefit from incorporating fundamental analysis to grasp the broader market forces at play.
Multiple Time Frame Analysis
When adding multiple time frame analysis into your moving average crossover strategy, aligning signals from different time frames is important for improving trade accuracy and effectiveness.
By examining more than one time frame, you gain a broader perspective of market trends, helping you to pinpoint more reliable entry and exit points. This approach minimizes risks and boosts the potential for successful trades.
Consider these steps to effectively use multiple time frame analysis:
- Start with a larger time frame to determine the overall market trend. This could be daily or weekly charts, which provide a clearer view of the prevailing trend direction.
- Switch to a smaller time frame to identify specific entry and exit points. Here, hourly or 4-hour charts can offer more detailed insights.
- Look for alignment between the trends in both time frames. A buy signal is stronger if both the shorter and longer time frames show upward momentum.
- Confirm with a third time frame, if possible, to refine your strategy further. This could be a mid-range time frame, bridging the gap between the two initially analyzed.
Incorporating Fundamental Analysis
While multiple time frame analysis sharpens your technical strategy, adding fundamental analysis can significantly improve your market predictions and decision-making process.
You’ll find that combining these analyses provides a more robust viewpoint from which to make your trading decisions.
Fundamentals involve evaluating the economic and financial health of the entities behind the stocks, currencies, or commodities you’re trading. You’re not just looking at price movements but also at why those prices might be moving.
It’s important to look at economic indicators, earnings reports, and even political events that could affect market conditions.
Here’s a quick guide to essential fundamental indicators to watch:
| Indicator | Description | Impact on Markets |
|---|---|---|
| GDP Growth | Measures economic activity and health | High impact |
| Inflation Rates | Indicates the rate at which prices rise | Medium to high impact |
| Unemployment | Health of the job market | Medium impact |
| Interest Rates | Cost of borrowing money | High impact |
| Consumer Confidence | Reflects consumer sentiment and spending | Medium impact |
Developing a Trading Plan and Maintaining Discipline
Developing a successful trading plan demands discipline and a strategic approach to navigate market volatility effectively. When you’re using the moving average crossover strategy, it’s essential to establish clear rules that dictate your trading actions. This helps in reducing emotional decision-making and guarantees consistency in your trading.
Here are some advanced concepts and tips that’ll help you succeed:
- Define Entry and Exit Points: Clearly define when you’ll enter and exit trades based on specific moving average crossovers. Stick to these points to avoid impulsive decisions.
- Set Risk Management Rules: Determine how much of your portfolio you’re willing to risk on each trade. A common rule is to risk no more than 2% of your capital on a single trade.
- Regularly Review and Adjust: Markets evolve, so should your plan. Set a schedule to review your trading strategy and adjust it based on performance and market conditions.
- Maintain Trading Discipline: Keep a trading journal to record your decisions and outcomes. This log will help you analyze your performance and maintain discipline over time.
Frequently Asked Questions
Can Moving Average Crossovers Predict Stock Market Crashes?
You’re asking if there’s a way to predict stock market crashes. In essence, no method can predict crashes with absolute certainty due to the complex and unpredictable nature of markets.
However, traders often use various indicators and strategies to try to anticipate major shifts. One popular method involves analyzing the movement of average stock prices over time to detect potential trends or warning signs, but it’s not foolproof.
How Does Market Volume Affect Moving Average Crossover Signals?
Market volume significantly impacts your analysis of stock trends. When volume is high, it confirms the strength behind a stock’s price movement, making your signals more reliable.
Conversely, if volume is low, it might suggest less confidence in the price changes, leading to potentially false signals.
You’ll want to watch for high volume accompanying significant price moves to trust the trends you’re observing and make more educated trading choices.
Are Moving Average Crossovers Effective in Forex Scalping?
You’re asking if using specific indicator crossovers is effective in short-term currency trading. While they can signal potential market entries, their effectiveness often depends on market conditions and volatility.
They’re not foolproof; you’ll see the best results when you combine them with other analysis tools.
It’s essential to test them in different scenarios to determine how they fit with your trading style and risk tolerance in the forex market.
How Do Major News Events Impact Moving Average Crossover Effectiveness?
When major news events occur, they can significantly impact stock prices and market volatility. This sudden change can affect the reliability of your trading indicators, including moving averages.
During these times, the averages may produce signals that aren’t as vital due to abrupt price movements. You must be extra cautious and rely more on comprehensive market analysis rather than solely on these indicators to guide your trading decisions during such volatile periods.
Conclusion
If you decide to use any version of the moving average crossover strategy, remember to consistently monitor your results and adjust as needed.
Start with simple moving averages, then investigate exponential ones to see which better aligns with your trading style.
Keep in mind the strategy’s limitations and don’t rely on it solely.
By combining this technique with other analyses and keeping an eye on market conditions, you’ll improve your trading decisions and potentially increase your success in the markets.