- February 8, 2024
- Posted by: Shane Daly
- Categories: Basic Trading Strategies, Stock Trading, Trading Article
Stock technical analysis is something that extends far beyond stocks, it covers the entire basket of trading instruments including commodities, FX, and even cryptocurrency. In this guide, we’ll look at how technical analysis, grounded in the idea that market prices encapsulate all known information, offers a unique lens through which to view the prices on your chart.
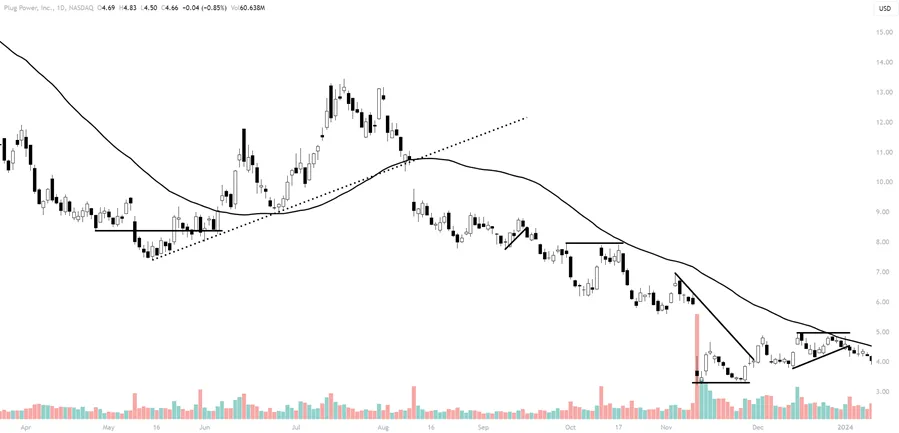 This method is versatile, and suitable for various trading styles, whether you’re analyzing price by the minute or over longer periods.
Technical analysis is not perfect. Like any approach, stock technical analysis comes with its own set of challenges, particularly the risk of misinterpretation, especially in scenarios of low trading volume and trading ranges.
This approach isn’t just for the technically minded; even those who lean towards fundamental analysis often use technical strategies to fine-tune their entry points.
TLDR
- Technical analysis is a way of making trading decisions in the stock market.
- The basics of technical analysis include studying price patterns, using indicators, analyzing different chart types, and considering various timeframes.
- Getting started with technical analysis involves familiarizing yourself with key concepts and tools, understanding support and resistance levels, learning about chart patterns, using technical indicators to confirm analysis, and staying informed about market news and events.
- The application of technical analysis allows traders to use tools and techniques to analyze market data, gain insight into market behavior, predict future price movements, and make better decisions on when to buy or sell stocks.
Importance of Technical Analysis
Technical analysis is a method of studying and evaluating market data, such as price patterns and trading volume, to predict future price movements and identify potential trading opportunities. By analyzing historical price data, technical analysts believe they can discern patterns that can help them predict future price movements.
This information, if understood, is valuable to all types of traders since it allows them to identify trends, judge market sentiment, and have more information to make trading decisions.
Basics of Technical Analysis
To get started with the basics of technical analysis, it’s important to understand the key principles and tools that can help you analyze stock market data effectively.
Here are four essential elements to understand:
- Price Patterns: By studying price patterns, such as trends, reversals, and support and resistance levels, you can identify potential buying or selling opportunities.
- Indicators: Technical indicators, such as moving averages, oscillators, and volume indicators, provide insight into market trends and momentum, helping you make informed trading decisions.
- Chart Types: Different chart types, such as line charts, bar charts, and candlestick charts, offer different perspectives on price movements and patterns, enabling you to spot trends and patterns more easily.
- Timeframes: Analyzing stock data across different timeframes, such as daily, weekly, or monthly, allows you to identify short-term and long-term trends that are useful depending on your strategy.
Getting Started
To get started with stock technical analysis, you’ll want to familiarize yourself with some key concepts and tools.
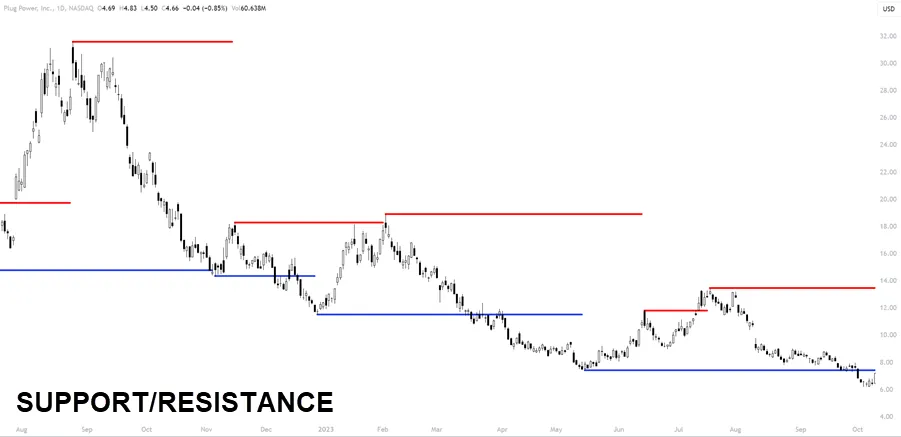
The first step is to understand support and resistance levels, which are price points where the stock tends to bounce off or break through. This is the most basic approach but can also be one of the most useful.
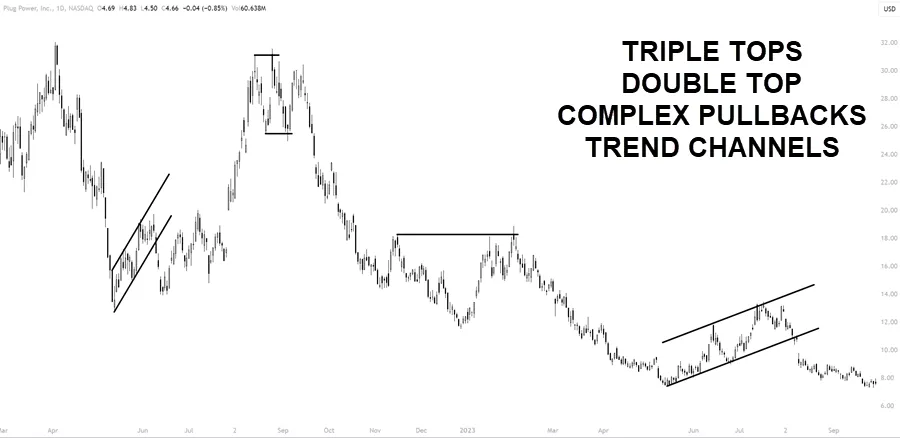
You’ll also need to learn about chart patterns, such as head and shoulders, double tops, and triangles, which can give you insights into the state of the instrument. One of my favorite patterns is the bull and bear flag which shows retracements against the dominant trend direction.
You may decide to use technical indicators like moving averages, relative strength index (RSI), and MACD to confirm your analysis. Keep in mind these are based on past price data and act more as a framework to base trades around.
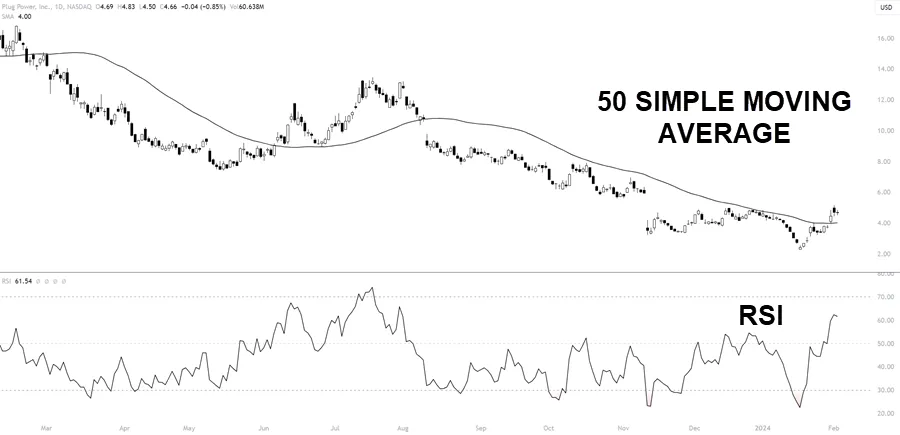 It’s important to stay informed about market news and events that can impact stock prices such as earning reports. These are foundational concepts and tools, that every trader must be familiar with before risking capital in the market.
Understanding Market Data
Now that you have familiarized yourself with key concepts and tools in stock technical analysis, it’s time to look into understanding market data. This is important because market data is the foundation upon which all technical analysis is built.
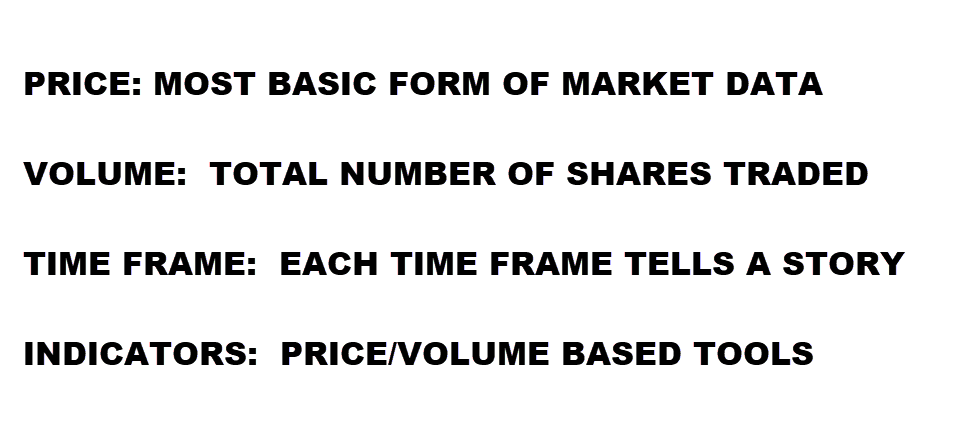 Here are four important things you need to know:
- Price: The price of a stock at a given moment reflects the supply and demand for that stock. It’s the most basic form of market data and is used to analyze trends and patterns.
- Volume: Volume represents the number of shares (contracts for futures) traded during a specific period. It helps determine the strength and validity of price movements. High volume often confirms a trend, while low volume may suggest weakness.
- Timeframe: Different timeframes are used to analyze market data, ranging from minutes to months. Shorter timeframes provide more detailed information, while longer timeframes show broader trends.
- Indicators: Various technical indicators, such as moving averages and oscillators, are used to interpret market data. These indicators help identify potential buy and sell signals.
Understanding market data is essential for successful stock technical analysis. By analyzing price, volume, timeframe, and indicators, you can make informed decisions and maximize your trading profits.
Application of Technical Analysis
The application of technical analysis involves using various tools and techniques we’ve covered to analyze market data. Think of how a detective gathers all the evidence and can put the pieces together to solve a crime.
 Trading is no different.
You take the information about price movements, strengths, and buying/selling pressure, and choose to either enter a trade, exit a trade, or sit on the sidelines.
Technical analysts use charts, indicators, and other charting tools to identify support and resistance levels, trend lines, and price patterns. By analyzing historical price and volume data, you can gain insight into market behavior and predict future price movements.
This can help you determine when to buy or sell stocks with a probability of one thing happening over another.
Tips You Can Use Now
Here are some actionable tips and steps to help you start applying technical analysis in your trading.
- Start with the Basics: Familiarize yourself with the fundamental concepts of technical analysis. Begin by understanding terms like support and resistance levels, trend lines, and moving averages.
- Choose the Right Tools: Equip yourself with the necessary tools. This includes a reliable trading platform that offers various chart types (like candlestick, bar, and line charts) and technical indicators (such as RSI, MACD, and Bollinger Bands).
- Learn to Read Charts: Develop the skill of reading and interpreting charts. Pay attention to historical price movements and try to identify patterns that could indicate potential future movements.
- Practice with Historical Data: Use historical data to practice your technical analysis skills. Look at past price movements and see if you can spot trends and patterns. This is a risk-free way to test your understanding.
- Use Technical Indicators Wisely: Learn how to use various technical indicators. Remember that no single indicator provides all the answers; use them in combination for better analysis.
- Understand Time Frames: Get comfortable analyzing different time frames. Short-term traders may focus on daily or hourly charts, while long-term investors might look at weekly or monthly charts.
- Keep an Eye on Volume: Volume is a key aspect of technical analysis. It can confirm trends and signal the strength of a particular move.
- Stay Informed: Keep up-to-date with market news and events. While technical analysis focuses on charts, being aware of external events can help you understand why the market is moving in a certain way.
- Practice Risk Management: Always have a clear plan for risk management. Set stop-loss orders and have a clear idea of your risk-reward ratio.
- Learn Continuously: The world of technical analysis is vast. Continue learning and evolving your strategies. Consider online courses, trading webinars, and books by expert traders.
- Start Small and Experiment: Begin with a small amount of capital that you can afford to lose. Experiment with different strategies to see what works best for you.
- Document Your Trades: Keep a trading journal. Documenting your trades, including your analysis, decisions, and outcomes, is crucial for learning from your successes and mistakes.
By following these steps, you can gradually build your skills in technical analysis and be ready to tackle any chart of any instrument.
Conclusion
Technical analysis is a versatile tool for traders in various markets. It involves analyzing price patterns, using indicators, and considering different timeframes. While not without challenges, it provides valuable insights into market trends and can complement fundamental analysis.
To get started, learn the basics, choose the right tools, and practice continuously. With technical analysis, you can make better trading decisions inside of a properly tested trading plan.
FAQ
How to perform stock technical analysis as a novice?
Begin by learning the basics of technical analysis, including price patterns, indicators, and chart types. Practice with historical data and gradually develop your skills.
What are the initial steps in commencing a stock analysis?
Start by gaining a fundamental understanding of technical analysis. Focus on support/resistance, chart patterns, and key indicators to make informed trading decisions.
How can you assess the stock market before trading begins?
Evaluate market conditions by studying price trends, volume, and technical indicators. This analysis helps you prepare for potential trading opportunities.
What marks the start of a technical analysis journey?
The journey begins with understanding the essential technical analysis concepts, such as price patterns, indicators, and chart types. Practice and continuous learning are key to success. Traders can find plenty of helpful information on this topic on our site.

