- April 18, 2018
- Posted by: Mark S
- Category: Trading Article

Learning to trade is a lot more than finding a trading system and start following the buy and sell signals.
I’m sure that many of us started with the belief that it would be that simple but were quickly brought back to reality.
A trading system is a lot more than a win rate.
The difficult thing to get across to anybody looking to trade is that the winning percentage is a small variable in what determines if your trading plan and system are any good.
Keeping in mind that trading is an actual business, it is vital that traders not only understand the risk that is involved but that trading rules must be employed that were determined from a testing of your system.
Yes, winning % does have a place in determining the long term viability of your trading business but there is more to trading success than how many times you win versus lose.
At the end of this article, I have a download for you to help you assemble the 10 numbers that traders should know in order to be consistently profitable.
10 Numbers Every Trader Should Know
In order to ensure your trading system and trading plan will give you an edge in the market, there are several metrics you should know. Whether you swing trade, day trade, or even scalp, knowing these numbers should give you confidence that you have a trading business that can survive.
Professional traders have a business plan that lists how they will operate their trading business. This will include when to withdraw funds, when to take time off, the markets they will trade, a high level overview of their trading business.
The trading plan will determine everything from trading setups to risk management and these are where professional traders excel. These traders would be able to give you an answer to each of these 10 metrics because they have done the work.
Your trading account depends on you following a trade plan with discipline and that the system and plan have an edge.
These metrics can help ensure you are trading with the probabilities on your side:
- Win rate
- Loss rate
- Average win
- Average loss
- Total number of trades
- Number of winning trades
- Number of losing trades
- Profit factor
- Statistical Expectancy (average profitability per trade)
- Expectation (mathematical outcome)
Win rate
Win rate is usually the metric that is first considered by new traders and often pitched by trading system or service sellers in aggressive advertising. Forex traders have seen just about every type of marketing that spouts the “never miss” trading system. Win rate is calculated by dividing the number of winning trades by the total number of all trades, and is often represented as a percentage.
Loss rate
Loss rate is the number of losing trades divided by the total number of all trades, or 1 – win rate. We hear of systems that have high win rates (or even systems that “never lose”), but in trading there are always trade offs. The most important metric to be linked with win rate is average win and average loss.
Average win
Average win is calculated by taking the sum of all winning trades and dividing it by the number of winning trades. It is the expected value of an average winning trade otherwise known as your average profit amount.
Average loss
Average loss is calculated by taking the sum of all losing trades and dividing it by the number of losing trades. It is the expected value of an average losing trade. Keep in mind that while this is your average loss, there is always the loss that hasn’t happened yet that can skew this amount.
Next time you are hit with promotions of trading systems that tout having a high win rate, the question you should be asking is if the average loss is much greater than the average win. If so, even the high winning rate trading system could still be a losing system bleeding your trading account.
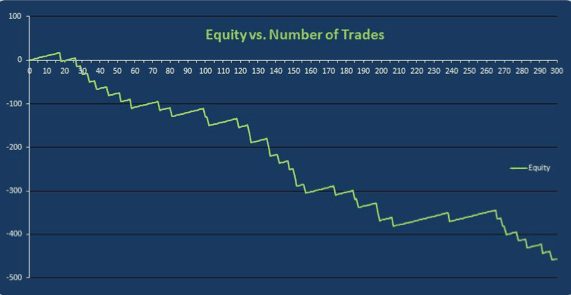
For the purpose of the following examples, I will refer to the gains and losses using dollars, however gains and losses can be expressed in dollars, points, ticks, pips or whatever. This graphic shows an example an equity curve resulting from 300 trades taken using a system with a high win rate of 90%, but with average losses that are 20 times greater than average wins.
These types of systems can be seductive because the high win rate is alluring for a while, and can often appear to be paying off, but then the inevitable losses occur, wiping out all gains.
An example of a strategy capable of this type of behavior would an option spread selling strategy. The premiums collected are small and predictable, but when the market suddenly moves against you, the losses can be significant.
Notice that the first 15 or so trades were winners, but the next trade wiped out the gains and returned to break even.
Also notice that there was a period starting around trade 205 that went for over 50 trades where results were positive, but again, subsequent trades wiped out all the gains, and then some. When the win/ loss ratio is this unfavorable, even a high winning rate is not enough to make up for the losses, and the statistics associated with these types of systems make them losers in the long run.
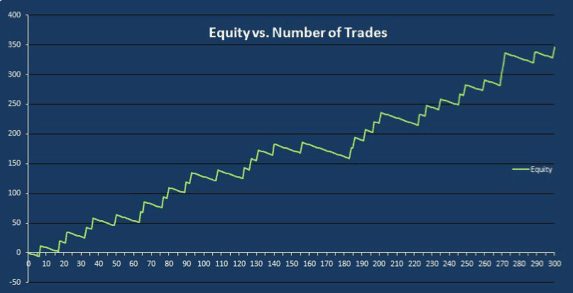
Here we have a trade plan with only a 10% win rate, but unlike the first trade plan, the average trade win is much higher than the average trade loss (18 to 1), resulting in a winning trade plan.
An example of a plan capable of this behavior is one where each trade risks a small amount of capital with the small expectation of hitting a home run. There are lots of small losers, but when the trade is successful, the gain is large.
This example starts with a number of losing trades, followed by a win that more than makes up for the losses.
Notice that the overall equity curve is positive, but there is a section in the middle where a string of over 50 trades is in draw down. Although these types of plans can be profitable, many traders find it difficult to handle the trade psychology, and the stress associated with long stretches of losing trades causes them to abandon the plan.
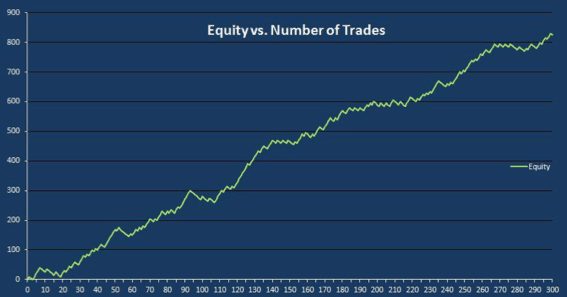
Here is a trade plan with a 50/50 win rate. Each trade is just as likely to be a winner as a loser, but since the average winner is twice as high as the average loser, the overall equity curve is positive.
Notice that there are periods of draw down just like the second example, but they tend to be shorter in duration because the overall equity curve is smoother. Since the number of winners is approximately equal to the number of losers, we don’t have long periods of either winners or losers.
Profit factor
How do we determine whether or not a trade plan has the potential to be profitable? Profit factor.
Profit factor is calculated as the ratio of the sum of all winning trades to the sum of all losing trades.
Profit factor = (gross winning trades) / (gross losing trades)
or
= (Win rate x average win) / (Loss rate x average loss)
Profit factor needs to be greater than 1.0 to have a winning plan.
That makes sense; it means you need more total winnings than total losses.
The second formula above shows how profit factor can be calculated using the win rate, loss rate, the average win amount, and the average loss amount. It is easy to see now why the first trade plan was a loser:
Trade Plan 1 Profit Factor = (0.90 x 1) / (0.10 * 20) = 0.45
Since the profit factor was less than 1.0, this plan was doomed from the start.
Here are the profit factors for the second two trade plans:
Trade Plan 2 Profit Factor = (0.10 x 18) / (0.90 * 1) = 2.0
Trade Plan 3 Profit Factor = (0.50 x 10) / (0.50 * 5) = 2.0
Both of these trade plans had profit factors greater than 1.0, and therefore were profitable. All else being equal, the higher the profit factor the more profitable the trade plan.
Statistical Expectancy
Another performance metric that makes use of the win rate, loss rate, average gain, and average loss is statistical expectancy.
This metric is calculated as: Expectancy = Net of all trades / Total number of trades or (Win rate x Average win) – (Loss rate x average loss)
This metric is also known as the average profitability per trade because it gives us the expected profit, on average, for each trade made. Here are the expectancies for the three trade plans above:
Trade Plan 1 Expectancy = (0.90 x 1) – (0.10 * 20) = -$1.10
Trade Plan 2 Expectancy = (0.10 x 18) – (0.90 * 1) = $0.90
Trade Plan 3 Expectancy = (0.50 x 10) – (0.50 * 5) = $2.50
Notice that, on average, the first trade plan is expected to lose $1.10 per trade, another indication that it is a losing plan.
After 300 trades, we can expect to lose on average about $330, and the chart shows this loss to be a little over $400.
The next two trade plans have the same profit factor, so you might be inclined to conclude that they are equally profitable, but notice that the trade plan 3 has a greater expectancy per trade. After 300 trades, we would expect that trade plans 2 and 3 would have net gains of $270 and $750 respectively. The equity charts above confirm this.
Notice that like trade plan 1, they are close to their expected values, but not exact, because again we are dealing with statistical expectancy.
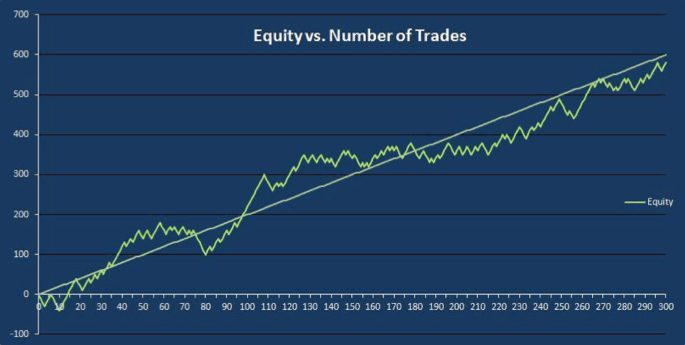
This example of expectancy is a trade plan with a 60% win rate, with average win of 10 equal to the average loss of 10. Using the above formulas, the profit factor is 1.5, and the expectancy is 2.
Even though the average win equals the average loss, this trade plan is profitable because the win rate is greater than 50%.
The graphic shows that with an expectancy of $2.00 per trade, we can plot the expectancy along with the actual trades to verify that the plan continues to be valid. If we see over time that the actual trade equity diverges from this line, then we know that the market has changed, and we will need to re-evaluate our plan.
This is useful because in order to analyze our trade plans, we need to include not only win rate, average wins and losses, and profit factor (to determine that we have a winning plan), but we need to add expectancy and number of trades in order to determine exactly how profitable we expect the plan to be over time.
Expectation
There is another statistic that is useful for determining how robust a plan is. It is called Expectation, or mathematical outcome, and is calculated as:
Expectation = Expectancy / Average loss
Expectation reflects how robust a trading plan is by measuring how sensitive it is to changes in average loss. The greater the ratio of expectancy to average loss, the higher the expectation. With high expectation, small changes in average loss will have little effect on our net profits.
As this ratio gets smaller, however, small changes in average loss will have a greater impact on net gains.
Some good rules of thumb for expectation are:
- If expectation is less than 0, then the expectancy (gain per trade) must be less than 0 and it is a losing plan that should not be traded.
- If expectation is between 0 and 0.5, then the plan is OK, but we should monitor our losses to make sure the average does not significantly change (get greater).
- If expectation is greater than 0.5, then we have a robust trading plan.
Using the formula above, expectation for the four example trade plans are:
Trade Plan 1 Expectation = -1.10 / 20 = -0.055
Trade Plan 2 Expectation = 0.90 / 1 = 0.9
Trade Plan 3 Expectation = 2.50 / 5 = 0.5
Trade Plan 4 Expectation = 2.00 / 10 = 0.2
It should be no surprise that the expectation for trade plan 1 is below 0, since it is a losing plan. Of the remaining three plans, trade plan 2 is the most robust with an expectation of 0.9. Expectation for trade plan 3 is right at 0.5, which means it is moderately robust, but should still be monitored.
Finally, trade plan 4 is the least robust, and although it is profitable, it should be monitored more closely for changes in conditions that might cause it to become a losing plan.
Trade Plan Potential
There are also other trade plan metrics that are useful for other purposes, such as fine tuning risk per trade, but the metrics presented here will at least ensure that a trade plan has the potential to be profitable in the long run.
This can be time consuming as you prove to yourself you have a trading edge but this is what successful traders do: they trade with a verifiable edge.
The next time you are being seduced by the calls of a high winning rate, ask for some other statistics. You can see that there are more vital variables to consider.
