- March 20, 2022
- Posted by: Shane Daly
- Category: Trading Article
There are many ways to make money trading and not all profitable strategies are complex. In fact, the best moving average strategy I know is simple in it’s construction. Best of all, there is an edge as it takes into account trend direction, price action, and an increase or decrease in average prices.
It doesn’t matter whether you trade Cryptocurrency, Forex, Futures, Stocks, this strategy will apply to any market and liquid instrument.
The biggest mistake you can make is to ignore the power of pullbacks against the main trend. These set up reversals back in the direction of the overall trend. Your order entry technique ensures that short term price movement is in your direction with this strategy.
Moving Average Strategy Outline
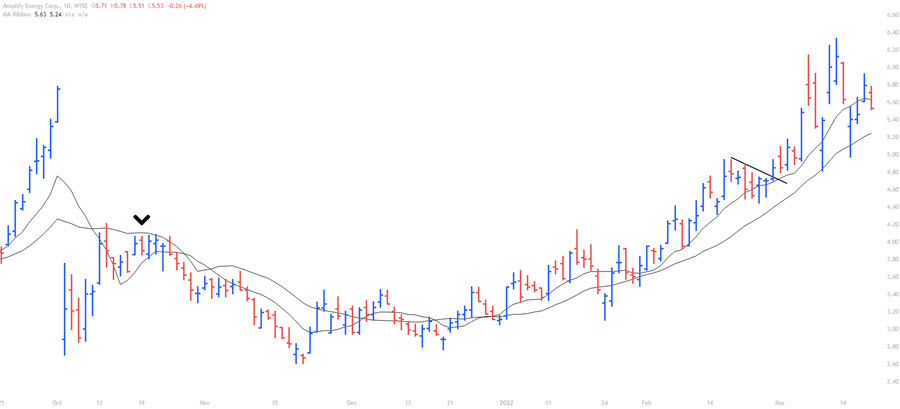
Take a look at what this strategy we will cover looks like on a chart. It’s a clean price chart without a lot of lines and indicators.
The two lines are our moving averages and the settings are a 9 SMA and 20 SMA.
Can you use exponential moving averages and a 10/21 period? Yes. The strategy is robust and minor changes will not have much of an effect. If we use longer periods for the averages such as the 50 period moving average, then we are looking at more of a longer term strategy.
There are a few important price movements to know for the basic approach to this strategy because I will show you two different setups.
Pullbacks
As shown on the right of the chart above, that is more of a simple pullback, meaning one swing, in the uptrend. For the complex correction, we’d like to see the second high a little more obvious.
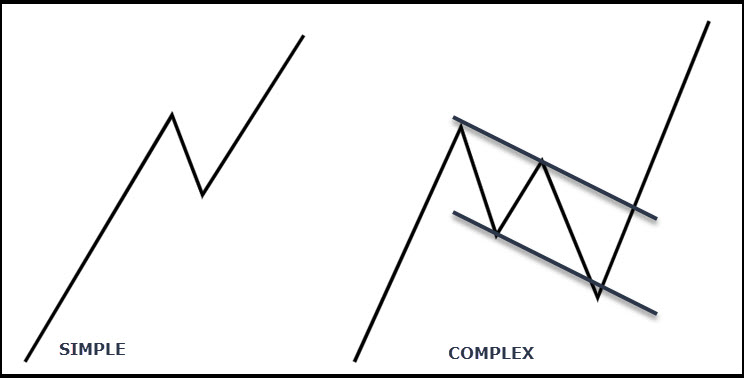
Pullbacks are a viable edge when trading in the direction of the trend. You can design an entire profitable trading strategy around this pattern.
Set Up Candle
On the left side of the chart, the arrow highlights a setup candle in this strategy for a downtrend. An uptrend would be the opposite. For the example in a down trend, we’d like to see this type of candle to set up our trade entry.
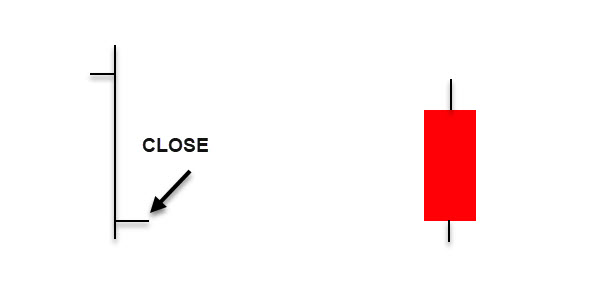
The main thing to note is the close position. The closer to the lows the better as it shows the sellers were strongly in control for this period. Anywhere near 25% of the candle to the low/high for the close is good enough.
This strategy can also use 2-4 bar pullbacks for trades. If looking for long trades, you will require X amount of lower highs and then look to take a trade off the setup candle formation. We will show that later on a chart.
What Do The Moving Averages Do?
The two moving averages are showing us the average price over the set lookback periods. Mean reversion is a function of the market where moves, after a period of time, tend to reverse to an area around an average price.
For our strategy, trend direction will be determined by price closing at least 3 times above or below both moving averages. It does not need to be consecutive higher or lower closes.
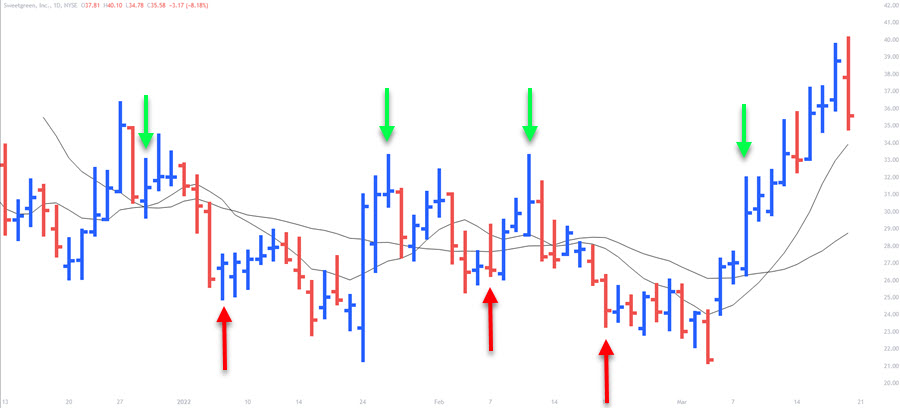
Requiring three closes above both moving averages, can help us avoid but not eliminate trading inside of a choppy market. The closes do have to be consecutive closes above or below the average. If you have two closes above the averages and then one below, the count will start over again.
Overextended Price Action
We can also use the moving averages and price relationship to the average to determine if we can expect a deeper pullback or a consolidation. This is not part of the strategy but can give you a good overall feel for the instrument you are trading. This, with experience, may impact your trading approach.

The other price moves were orderly until we get to the right of the chart. It is an obvious move that is much different than the other moves. At this point, something has changed in the market. We can expect to see a deeper pullback or a range form. These are the points you’d expect a complex correction. The black arrow on the left is another example but is not as obvious due to the scaling of the chart. This was almost a 30% move up in price and price formed a consolidation to digest the large move.
Outline Recap
So far, you have learned the type of moving averages to use as well as minor changes you can make to them without affecting the moving average strategy.
Pullbacks come in two forms, simple and complex, and is one of the setup patterns we will look for.
Setup candles are another setup we can use when looking to trade in the direction of the trend.
Our moving averages will be used, along with price, to determine trend direction and a market that may be due for a deeper or longer correction.
Moving Average Strategy
Let’s being from scratch and walk through some examples of this strategy. When you are testing any strategy, a quick way to judge if it is worth considering, is using the 1R testing criteria.
1R Testing Technique
Using this technique, you look for a 1R profit target on the trade. If price is able to move 1X your risk amount, there is no reason to ever let it turn into a losing trade. You may already have a good strategy but are trying to always hit home runs instead of base hits when thinking of taking profits.
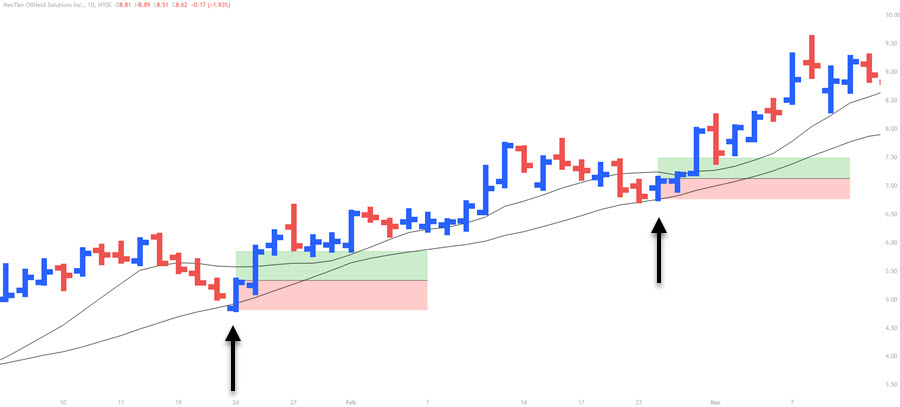
To show this example of 1R testing, this is one part of the strategy we will discuss, that you can use.
+ Enter at break of the high of the setup candle (we will cover what exactly that is)
+ Stop goes below the low of the setup candle
+ Difference between entry price and stop price projected from the high, is 1R
You can eyeball the length of the entry setup candle once you’ve done this enough. It cuts down on wasting time looking at a strategy that can’t even get a 1R target.
Moving Average Strategy Trade Walkthrough
This is a daily stock chart of EGY and shows several different trades using the two setups. I am using 1R targets although there are many ways to take profits including trailing stops.
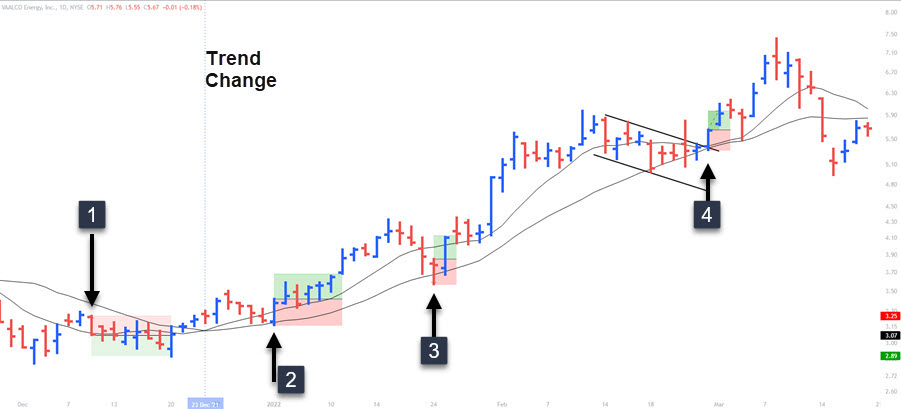
Our first trade is a short using the candle pullback method. I like to see 3 candles in the pullback but some may prefer 2 to 4. In a downtrend, these candles must make 3 consecutive higher lows. You can see the 1R target was just hit and price rallied.
The second trade occurs after the trend change that had 3 closes above the moving averages. We get 4 lower highs and a perfect setup candle that closes near the high. On the sixth day, the 1R target was hit.
The third trade is another great setup with a four bar pullback and although the bar closes red, the closing price was close to the high of the session only being off by 7 cents.
Trade number 4, price has moved further above the shorter term average. We also see the short term average moving away from the longer term average. This is where we could expect to see a complex pullback as something as changed in the market. I used a break of the down trend line for an entry but you may also choose to use the setup candle method of entry.
Depending on your entry off a pullback reversal, your stop will either be under the swing of the flag for a long or the low of the setup bar for that method.
Setup Candle – Inside Bar
There will be times that you will get a good setup candle as an inside bar. Let’s look at trade number four as an example.
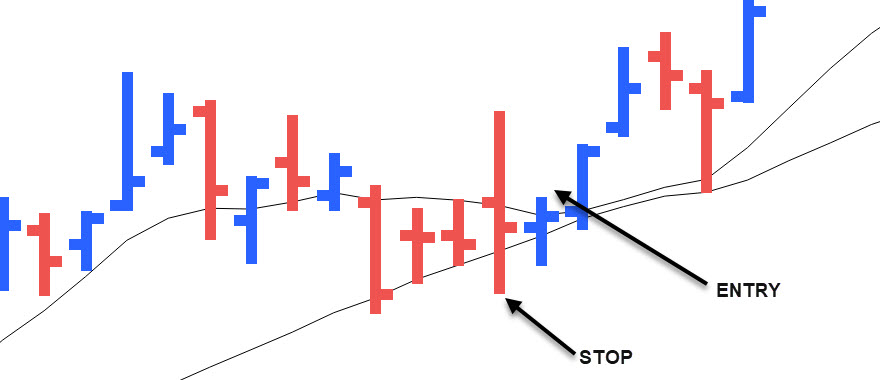
Whether using a flag pattern or the setup candle technique, an inside bar setup will have the stop loss going under the mother bar candle.
Bitcoin
With the extreme moves we are seeing in Bitcoin, it’s a good chart to see how the strategy stacks up. The blue lines represent trend direction changes.

The first trade is a bear flag that gets triggered after the trend line break. 1R target easily hit with the momentum push down. The lows also had momentum and as mentioned at the start of this guide, big moves will generally see mean reversion and traders should be on alert for a complex pullback.
Trade two is a long trade using the setup bar method. We have three lower highs and then the setup bar. Triggers in and hits 1R targets.
As you can see on the right, Bitcoin is choppy and our trend change rules keeps us from looking for setups.
Which Setup To Use?
Every strategy is going to be treated differently by each trader because each trader will see the movements in price a little differently.
We can give some general guidelines as to what setups to use at a particular time but in the end, it’s just how I see things based on experience and thoughts about price movement.
Using The Flag Pattern
Using the last chart and the first trade as our example, there is a reason why the flag was used.
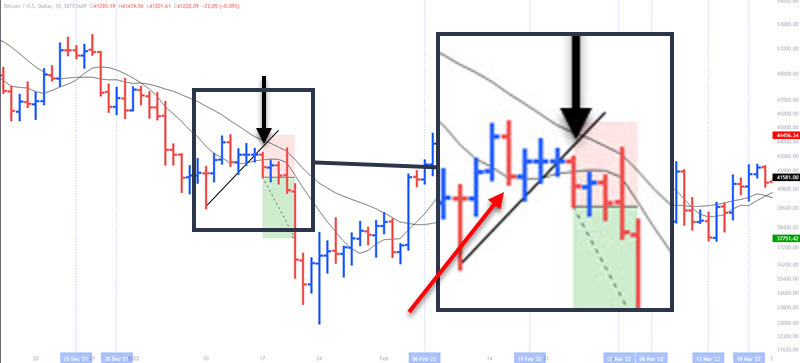
The reversal off the lows was pretty strong as shown by the closing price being near the highs. This will often mean the pullback will be a little less orderly.
The pullback starts off promising for the setup bar method. We get two higher lows but the red bar breaks lower than the second bar negating the count. We then resort to drawing a trend line for a complex pullback. This is not a perfect complex pullback as price failed into a trading range for a bit, but it’s close enough.
The main point is that the setup bar strategy was cancelled and we look for a flag pattern for the potential trade.
Using The Setup Bar
Looking at the same chart, we see an orderly pullback that puts in 3 lower highs which is my rule for the pullback in an uptrend.
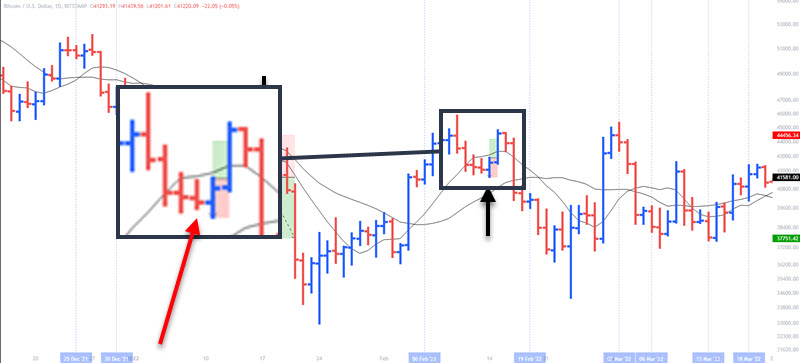
The red arrow points to the third lower high and is an inside bar. If that bar had closed near the highs, we would have gone long on the break and used the low of the mother bar for the stop. The next bar closed up with the closing price in the upper quarter of the bar and is the setup bar.
Currency Chart – 1 Hour
I am showing this chart due to the large setup bar that is a valid trade. It is much larger than surrounding bars, the stop is wide, and price would have to move further to hit 1R.
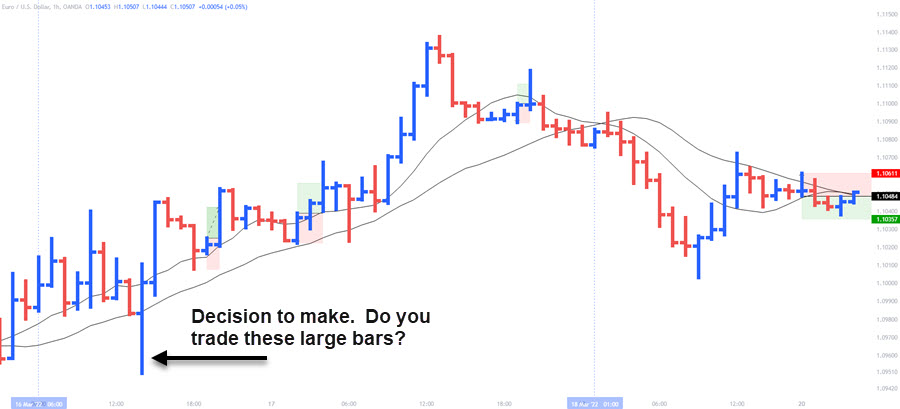
Price does not travel the 60 pips (which is the difference between entry and stop loss) and a trader would be sitting through grinding price action before hitting target. That is a decision you have to make for your trading plan. Do you trade these bars that are standing out like this? Personally, I skip these large bars.
You can clearly see the other setups all reached 1R targets. The trade on the right is still underway.
Trailing Stops
I know there will be those who want more than 1R and trailing a stop is a potential technique. You can use a X bar stop as your protective stop loss under 1, 2, or 3 bar lows for a long. Using the moving averages, either the short or longer period, and trailing your stop around the average could be an idea.
You may find that a trailing stop adds very little to your strategy and that taking around a 1R profit gives a better win rate and gains overall.
Recap
Look for price to have three consecutive closes above or below both moving averages for the trend direction.
Decide on how many bars are needed for a pullback using the setup bar technique. I use three but you can use any number you choose.
If the setup bar technique is cancelled, look to trade a flag pattern, either bull or bear flags.
Stop loss will go in a different location depending on strategy. Using flags, the stop will go below the low of the last swing. Using the setup bar strategy, it will go below/above the setup bar. Inside bars as setup bars will see the stop loss under or above the mother bar.
Consider taking 1R profits on the trades.
Is The Best Moving Average Strategy?
With the amount of strategies available to a trader, it is impossible to say with confidence that this is the best.
I will say that it takes into account the tendency of the market to mean revert. You are triggered into a trade after a certain number of bars in the pullback as price resumes the trend. You are able to determine whether you are trading a complex pullback with a flag or a simple correction using the setup bar method. It will do a decent job of keeping you out of choppy markets as we see with the Bitcoin chart. Most of all, the entry and the stop loss is an objective price with many trades hitting 1R targets.
The truth is, while you may read to only take 3:1 reward to risk ratios, the truth is you never know if you will get 3R. You will get many many more 1R winners in your trading than you will 3R profits.
I use a form of this strategy in my own personal trading. The guidelines above are just guides. You may be excellent at reading price action and only require a two bar pullback. You have to know what you are capable of as a trader.
Take some time to do the 1R test, build out some trading rules, and see if it is something you could do well with.
