
- April 30, 2024
- Posted by: Shane Daly
- Categories: Day Trading, Trading Article

You’ve likely heard about the 10-period moving average strategy. It’s popular with traders wanting quick profits from short-term market trends. Watching the crossover of the 10-period EMA and 20-period SMA helps spot the best times to get in and out of trades.

But, it’s not as simple as it seems. The key lies in understanding the small details that can impact your trading results when using any crossover technique. How do you tweak your strategy in various market conditions? How do you mix in other technical indicators for better results?
Main Points
- Utilize an intraday chart with 10-period EMA above 20-period EMA to identify long entry points.
- Enter short positions when the 10-period EMA falls below the 20-period EMA.
- Confirm trend direction with moving averages from higher timeframes before making trades.
- Set stop losses beyond the nearest support or resistance level to manage risk effectively.
- Use trailing stops to secure profits as the market moves in favor of the position.
Best Moving Average Settings
For a solid intraday trading strategy, think about using the 10-period moving average (EMA) with a 20-period simple moving average (SMA). This will help you spot moving average crossovers, a dependable method for identifying trends and timing entries.
When the 10-period MA moves above the 20-period SMA, it’s a positive sign and might be a good time to consider a trade to the long side. If it goes below, you might want to sell.
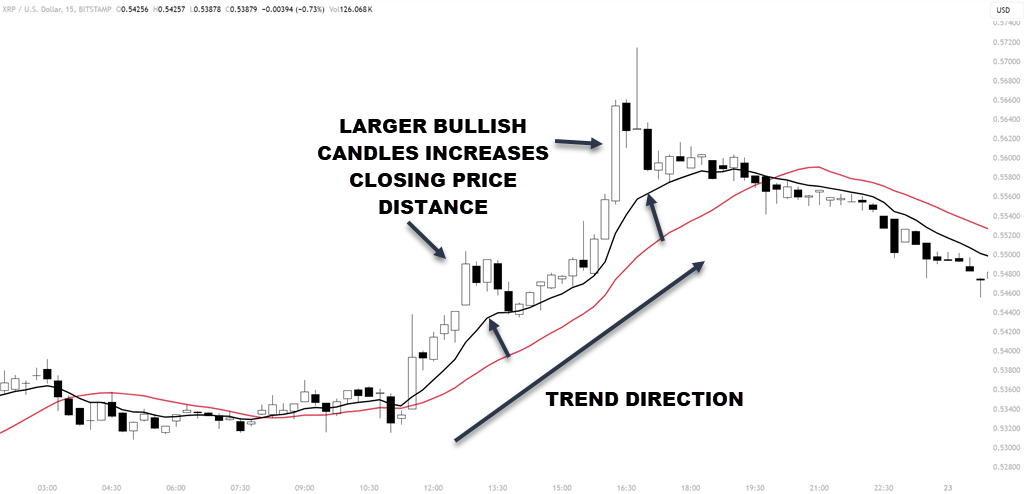
Trend identification is important. The direction and distance between the MAs can show the trend’s strength. A bigger gap usually means a stronger trend, giving you more confidence in your trades. The reason one moving average pulls away from the other average is due to closing prices being plotted with a larger gap than the previous close.
You’ll also need to check price volatility. By seeing how the MAs react to big price changes, you can measure the market’s volatility. If the 10-period MA crosses often with the 20-period SMA, the market might be more volatile, and is risky to take on a position.
Adding signal confirmation techniques can make your strategy more reliable. Check the signals from the 10-period MA with those from higher timeframes, like the 50-period MA on a 30-minute chart. This makes sure you aren’t taking on trades due to short-term price spikes or drops.
Entry and Exit Rules for 10 Period Strategy
With the 10-period MA strategy, you’ll be on alert to go long when the 10-period EMA goes above the 20-period SMA, and short when it goes below. These are your main entry signals showing possible trend shifts.
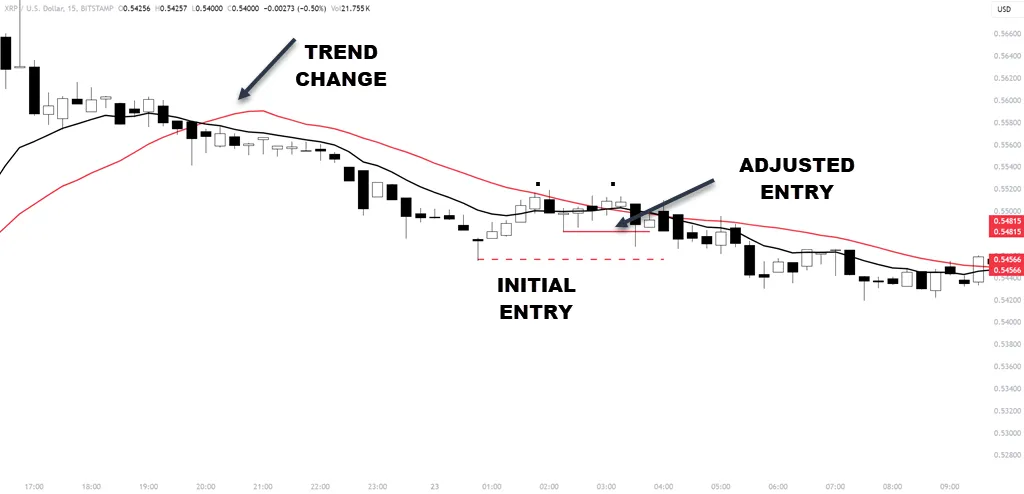
Wait for the price to put in high or low and retrace. You will put a pending order to go long or short once the price breaks the retracement high/low.
If the price puts in a micro swing inside the main swing, move your pending order to that zone (example in chart). This adjustment can only be done if the swing is not taken out or you get a setup in the other direction.
Always check the trend direction with a higher timeframe MA, like the 50-period MA on a 15-minute chart, to make sure you’re not trading against the market direction.
For exit strategies, close your long position when the 10-period EMA goes back below the 20-period SMA. End your short trades when the 10-period EMA goes back above the 20-period SMA. These exit points help manage risk and avoid big losses during sudden market shifts.
The previous exit strategy may be a little too conservative for many traders. You can also consider exiting:
- When the price puts in an exhaustion candle
- If the price closes above/below any of the moving averages
- If you have made a certain risk multiple in profit (2 X your risk)
To maximize gains, set profit targets based on the Average True Range (ATR) multiple. For example, if you’re going long, your profit target could be the entry price plus four times the 10-bar ATR. This method makes sure your targets adjust to current market volatility.

Use trailing stop losses to protect your profits as the trade goes on. Once the trade moves in your favor by a set amount, like 1 times the ATR, move your stop loss to break even. This strategy secures profits and minimizes potential losses if the market reverses suddenly.
Ideal Markets for 10-Period MA Strategy
The 10-period MA strategy does well in trending, volatile markets like forex pairs and high-beta stocks. These markets typically have clear trends and large price movements. This strategy does well with rapid price changes, so it’s perfect for volatile markets.
If you want to maximize the strategy, focus on intraday timeframes, specifically the 1-minute and 5-minute charts. These charts allow you to catch quick movements, which are important for the 10-period MA strategy. It needs quick trend confirmations to work well. Some instruments such as crypto will be better traded on a 15-minute and above.
Here’s a table outlining the ideal conditions and markets for this strategy:
| Ideal Conditions | Ideal Markets |
|---|---|
| Trending (avoid choppy) | Forex pairs, Crypto |
| Clear trend alignment | High-beta stocks, Futures |
| Use of multiple MAs for trend confirmation | Intraday timeframes (1-min, 5-min) |
Avoid markets that are range-bound or choppy, as the strategy struggles without a clear direction. Stick to environments with pronounced movements and clear trends. This approach helps you use the strengths of the strategy and avoid its weaknesses in less ideal conditions.
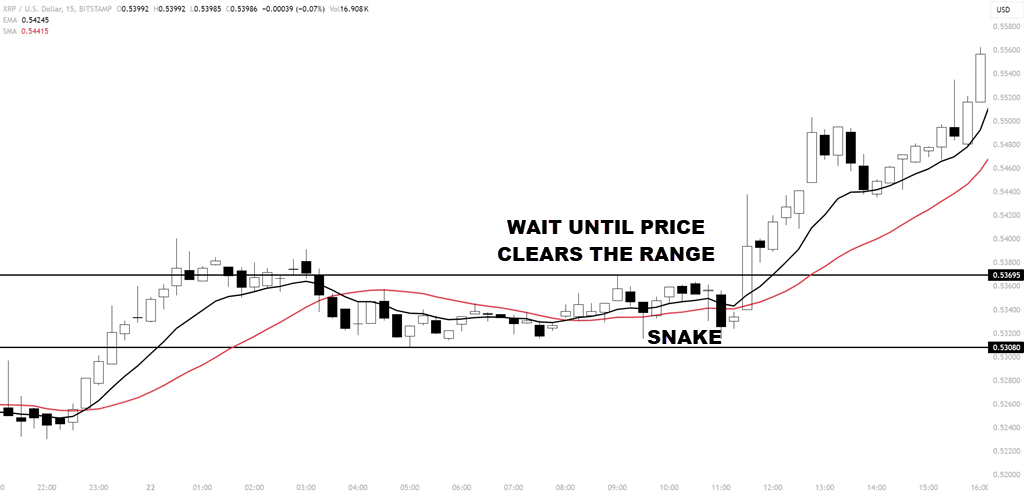
It is simple to see range-bound markets as price tends to whip around the moving averages. When you see this “snake-like” effect, stand aside or change your trading approach.
Risk Management and Position Sizing
First, let’s talk about position sizing. A practical guideline is to only risk 1-2% of your total account on a single trade. For example, if your account’s $10,000, you’d risk around $100-$200 per trade. This minimizes the impact of any single loss and allows a run of losing trades without damaging your account.
We need to set the stop loss correctly. It’s the backbone of solid risk management. Put your stop loss just past the nearest support or resistance level keeping an eye out for other areas that would make sense. This placement helps reduce risk while allowing some price fluctuation before moving in your direction.
Let’s also discuss the use of a trailing stop. As your trade moves in your direction, adjust your stop loss. Let’s say the trade moves in your favor equivalent to 1 times the ATR, move your stop loss to break even. This method locks in profits and prevents a profitable trade from becoming a loser.
Sticking to these rules with discipline and consistency is important. Don’t let emotions control your trading decisions. Adhere to your predetermined risk parameters and position sizing rules. Over time, this disciplined approach optimizes your risk-reward ratio.
Complementary Tools for 10-Period MA Strategy
Consider pairing the 10-period MA with extra technical tools like larger timeframe moving averages and momentum oscillators. These can confirm the trend and improve your entry and exit points, making trade entries when the setup is still fresh. Getting into an instrument that has already started moving increases risk and lowers profit potential.
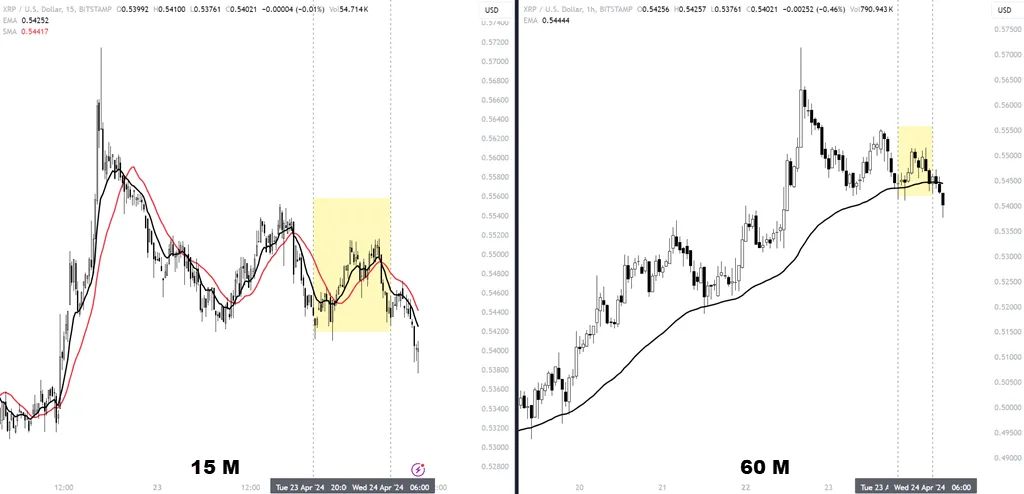
First off, mix the trading time frame with larger timeframe MAs, like the 50-period MA on a 30 or 60-minute chart. This combo validates the broader trend, making sure you’re trading aligned with the market’s direction, lessening the risk of false signals. Different short-term MAs, like the 5, 8, 12, or 20-period MAs, can be useful too. By watching crossovers between these MAs and the 10-period MA, you’ll get clearer signals on when to enter or exit a trade, reinforcing your trend confirmation.
Rule of thumb: higher time frame is 3-5 X your trading time frame
Next, add momentum indicators like the Relative Strength Index (RSI) or Stochastic Oscillator. These confirm the momentum behind a move signaled by your 10-period MA, avoiding trades in overbought or oversold markets.
Keep an eye on candlestick chart patterns and price action around these MAs. This analysis can offer deeper market sentiment clues and potential reversal signals before any crossover, making your strategy stronger.
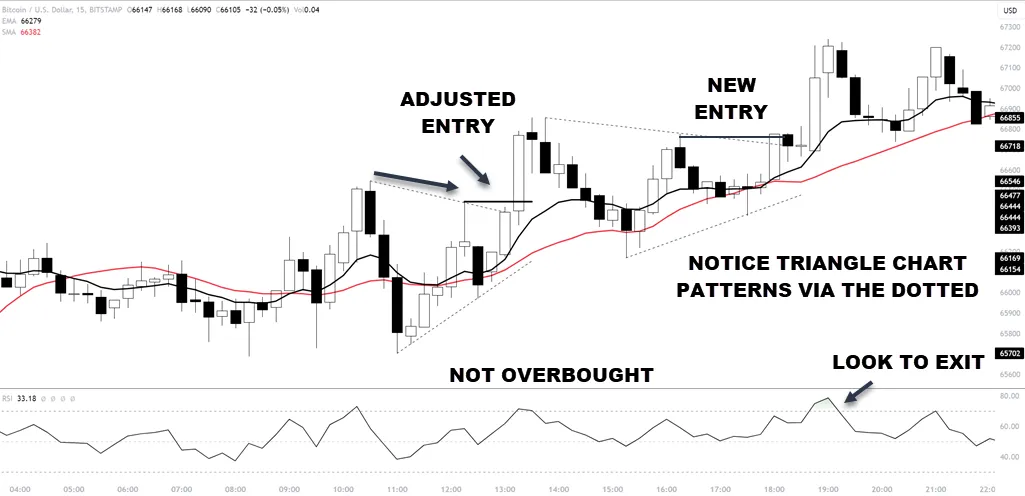
A lot of information on this chart includes:
- Adjusted trade entry
- New entries
- RSI usage to avoid overbought trading
- RSI to avoid trades and exit warnings during overbought
- Triangle chart patterns often lead to strong breaks (often short-lived on a lower time frame)
Remember to establish key support and resistance levels, which can be used for setting logical stop loss and profit targets.
Apply strict risk management techniques, such as proper position sizing and the use of trailing stops, to protect your capital and lock in profits as the market changes. By mixing these tools and strategies, you’ll improve your trading method, leading to potentially larger and more consistent profits.
Conclusion
To succeed with the 10-period moving average strategy, stick to specific settings and guidelines. Utilize a 10-period Exponential Moving Average (EMA) and 20-period Simple Moving Average (SMA) to determine clear entry and exit points. It’s best to select markets with high volatility, and risk management is always important regardless of your strategy.
Additionally, improve your strategy by incorporating momentum oscillators and learning to read the price action. Consistency and discipline are paramount for reaping fast profits in rapidly moving markets.
FAQ
What is a 10-period moving average strategy?
The 10-period moving average strategy involves tracking the average closing price of an asset over the last 10 periods to identify trend direction. Traders use this moving average to make buy or sell decisions by observing whether the price is above or below this average.
How does the 10-period moving average strategy work for quick profits?
This strategy helps traders capitalize on short-term momentum by initiating trades when the price crosses the moving average. A buy signal is generated when the price moves above the moving average, and a sell signal when it drops below, aiming for quick entries and exits.
What are the steps to implement a 10-period moving average strategy in trading?
To implement this strategy, first select your asset and chart type, then apply a 10-period moving average. Watch for the price to cross this average to determine entry points—buy when the price is above and sell when below. Finally, set appropriate stop-loss and take-profit levels to manage risk.
What are the advantages and disadvantages of using a 10 period moving average strategy for quick profits?
Advantages: Quick detection of trends, simplicity of use, and applicability across different markets and time frames. Disadvantages: Potential for false signals due to market noise, the inherent lag of moving averages, and increased transaction costs from frequent trading.
How can I effectively use the 10 period moving average strategy in conjunction with other technical indicators for successful trades?
Enhance the 10 period moving average strategy by integrating it with other indicators like the RSI or MACD to confirm momentum and trend strength. Additionally, using volume indicators can help validate the movements suggested by the moving average, reducing the likelihood of false signals and improving trade accuracy.
