- September 9, 2020
- Posted by: Shane Daly
- Category: Trading Article

The Williams %R (percent R) momentum oscillator indicator is an oversold and overbought technical analysis tool. It is similar in use to the Fast Stochastic Oscillator and traders will often use it for a buy signal or a sell signal.
The Williams %R indicators formula calculation includes:
- Highest price high in the last N periods
- Lowest low in the last N periods
- Most recent closing price
The formula for the Williams %R is:
(highest high (over N periods) – most recent closing price) / (highest high (over N periods) – lowest low (over N periods)).
The period length represents the look back period and the default is 14 periods.
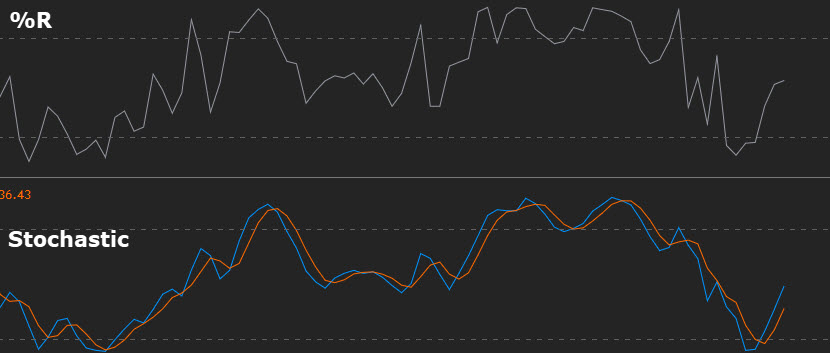
You can see both of these indicators, set to default look back periods of 14, give virtually the same oversold and overbought levels. The main difference is the two lines of the Stochastic Oscillator can be used as entry and exit signals on the cross.
Dangers Of Oversold And Overbought
The oscillator tells you when markets are oversold or overbought. Too many traders think an extended market (overbought reading) is coming close to rolling over. Same with an oversold reading, traders think a rally is coming.
With the Williams %R, oversold levels are -80 to -100 and overbought levels are -20 to 0. In other words, it is a bound oscillator between 0 and -100.
The truth is that markets can stay extended for a long longer than your account can. Oversold conditions are not always bullish and overbought are not always bearish.
We’ve all seen where price is hugging the upper or lower bands of a Keltner channels or Bollinger bands and riding in the direction of the trend.
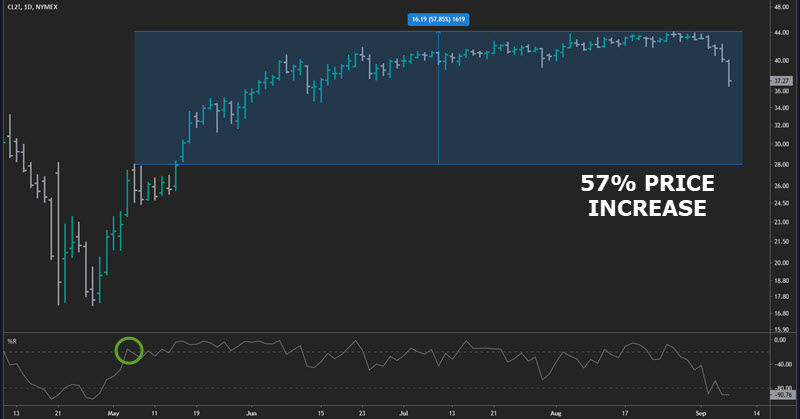
Imagine shorting simply because the Williams %R Oscillator went into overbought territory. There are plenty of examples of an oscillator in oversold territory and just churns there.
That draw down would have been painful as it’s a fairly strong uptrend and it’s a good lesson to not follow any technical indicator blindly.
Williams %R Trading Strategy
There are many ways to use this momentum oscillator and one simple way is to use overbought territory as a sign of strength and oversold as weakness. We can also use a moving average such as the 20 or 50 period to help us with trades.
Let’s take a look at a day trading time frame of 15 minutes of the Bund. You can use a lower time period or a higher one. I just chose one at random.
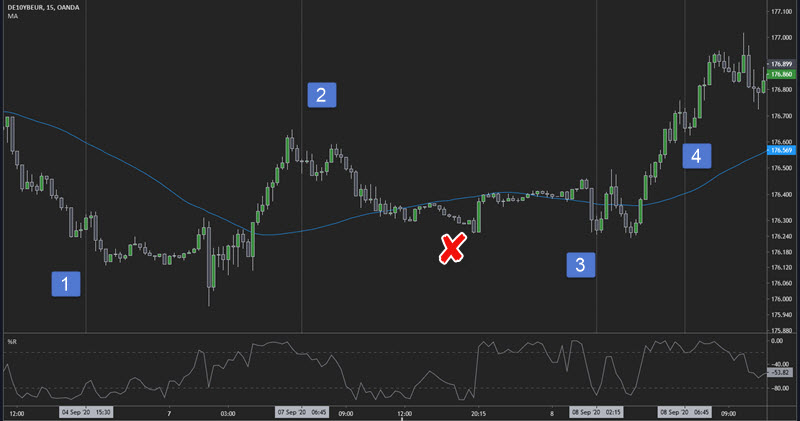
The red X shows an bearish momentum in the oscillator but our 20 period moving average is showing an uptrend. We would ignore any of the trade signals that are against the trend.
What we need to see is the indicator to make an overbought or oversold signal and then wait for a pullback in the indicator that takes it out of that condition.
For example: oversold condition and reading of -85 and then the pullback to -79.
The premise behind this strategy is that markets, when in those conditions, can pause and work off that condition and then continue to make a strong trend.
We can then use price action, chart patterns or a simple support or resistance breaks to enter the market. You can even use a lower time frame to enter your trade via breakouts.
- Market is in a strong down trend, the oscillator hits oversold and then pulls back. Simple break of lows or lower time frame entry
- Big run up in the market and we get an overbought signal while the current trend is up. Price pulls back with the indicator. Trend line break entry although the trade is short lived (we will come back to this one)
- Moving average slopes down, oversold, pullback in price, double top and a quick move down
- The pullback in the indicator is slight. Pullback in price.
Stops and targets could simply be a multiple of the average true range to keep things simple.
What happened at number two?
What we have here is a momentum failure. The indicator gets into the overbought zone, we get the pullback and we never regain the -20 line.
We can see that in the price as well but there will be times it is not as obvious just by the price action.
Taking a long position is high risk as we are being told that momentum is not stepping back into the market and the primary trend could be in trouble.
What About A Trading Range?
Momentum trading is not what you want to do in a trading range. We can still use a momentum oscillator but we need to use it a different way.
First define a trading range for yourself. Mine is simple: once the trending pattern is broken, I consider a trading range until proven otherwise.
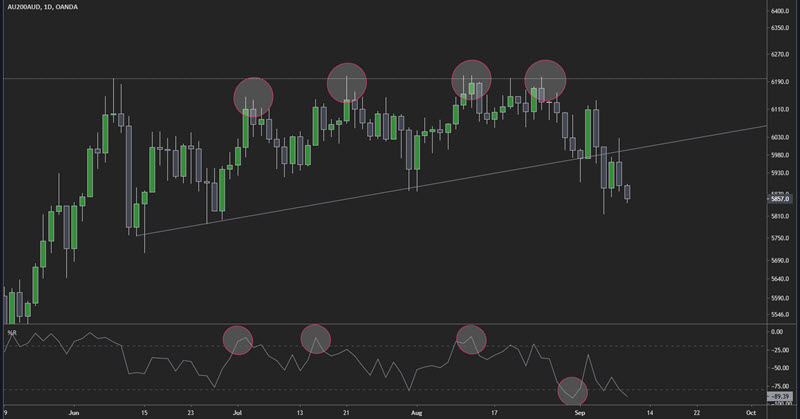
Not all of these are A1 types of trades but it does show how the indicator works in a range.
- When the oscillator is overbought and the price is near the extreme, look for a sell entry
- Oversold conditions needs price getting close to a resistance zone where you would look to buy
Just like using the Stochastic Oscillator in a trading range, you look to fade the extremes at those important levels until a breakout occurs.
Wrap Up
- Williams %R is a momentum oscillator
- It shows when the market has oversold conditions and overbought conditions
- Current direction of the trend is not guaranteed to reverse in those conditions
- Using price action and trend direction is better than simply trading the signals
Give it a try on your favourite market and see if it increases your success rate.