- July 25, 2022
- Posted by: Shane Daly
- Category: Trading Article
When trading, every trader needs to use a trading strategy that includes how they will enter and exit the stock. The method a trader will use must be written in their trading plan before risking anything in the market. A trader’s entry method should be based some type of technical analysis with either a technical indicator or price action.
In this tutorial, we’ll look at how to use a technical indicator and price action to identify an entry point when trading equities.
We’ll look at two distinct long-entry strategies:
Finding an entry using the MACD indicator is one example, and finding an entry utilizing price action.
Using The MACD Indicator To Find A Trade Setup
The MACD indicator is one of the most popular technical indicators used by traders. The MACD stands for Moving Average Convergence Divergence and is used to measure momentum in the market. The MACD is calculated by subtracting the 26-period Exponential Moving Average (EMA) from the 12-period EMA (closing prices). A signal line is then created by taking the nine-period EMA of the MACD. The MACD Histogram is used to further measure momentum by taking the difference between the MACD and its signal line.
 The MACD indicator can be used to trade stocks by finding divergences between price action and the indicator.
A bullish divergence occurs when the stock price makes a new low, but the MACD starts to make new highs. This is an indication that momentum is starting to shift and the stock may be ready to move higher.
A bearish divergence occurs when the stock price makes a new high, but the MACD begins to head to the downside. This is an indication that momentum is starting to shift and the stock may be ready to move lower.
Using the chart above, you can see on the left where price made a lower low but the MACD (default settings) made a higher low (bullish divergence). On the right, we have two peaks and while the last price peak is higher, the MACD made a lower high (bearish divergence).
On the first setup, entering on a break of a down sloping trend line with your stop loss at the lows is a viable approach.
The second setup is using a variant of the 2B reversal. Once price reclaims the previous peak, a trade entry can occur. Stop loss goes above the high of the pattern. Bearish divergence is most often used with stocks to lock in profits or in some cases, exit the trade.
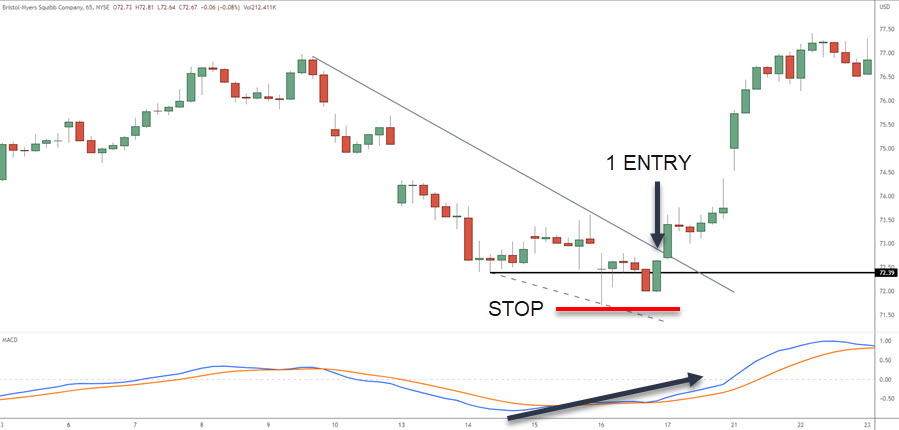
Using a 65 minute chart, here is an example of bullish divergence, which most traders will want to focus on.
Price makes a new low while MACD is trending upwards. Trade entry can be off a reclaim of prior support (when price breaks back above it) when accompanied with a bullish candlesticks. Traders may also enter after a down trendline is broken as we saw earlier. In either case, stop loss is better served under the extreme low of the pivot.
Profit targets come in many variations. From trailing stops to a multiple of your risk, a trader will have to decide which suits them the best.
Using MACD Bullish Divergence And Trendlines To Enter A Trade
When looking at a chart, you will want to find bullish divergences and use them to your advantage. A bullish divergence occurs when the MACD line is making higher lows while prices are making lower lows. This indicates that momentum is starting to shift and that the stock may be ready to move higher. To confirm this, you will also want to see a break of the downtrend line. This is where you would enter the trade.
The stop loss would be placed below the most recent low and the target price could be set at a prior resistance level. This setup could have a good risk to reward ratio and can lead to some nice profits if you’ve caught the changing of a trend.
How To Use Price Action To Find A Trade Entry
There are many ways to use price action to find a trade entry. One way is to look for simple candlestick patterns such as reversals or continuation chart patterns.
Reversal patterns occur when the market changes direction and can be used to enter a trade in the opposite direction.
Continuation patterns occur when the market continues in the same direction and can be used to enter a trade in the same direction.
Most popular candlestick patterns
There are many patterns you can use on a candlestick chart and you want to choose the ones you can easily read. Remember, the pattern is simply telling us who is winning the buying/selling battle at that point in time.
 Hammer: A hammer is a candlestick that has a small body with a long lower shadow. This pattern forms when the market is falling and reverses to close near the open. The long lower shadow indicates that there was significant selling pressure, but the buyers were able to push the price back up by the end of the day. These are generally a buy signal.
Inverted Hammer: The inverted hammer is the opposite of the hammer and has a small body with a long upper shadow. This pattern forms when the market is rising and reverses to close near the open. The long upper shadow indicates that there was significant buying pressure, but the sellers were able to push the price back down by the end of the day. These are often used as a sell signal.
Bearish Engulfing Pattern: The bearish engulfing pattern is a two candlestick pattern that forms when the market is rising. The first candlestick has a small body and the second candlestick has a large body that completely covers the first candlesticks real body. Some traders prefer the entire price range of the previous candle to be covered. This is a bearish reversal pattern that indicates that the sellers are starting to take control of the market.
Bullish Engulfing Pattern: The bullish engulfing pattern is the opposite of the bearish engulfing pattern and forms when the market is falling.
Candlesticks such as these will show up all over the candlestick chart and location matters when using them. Let’s now talk about where to find these candlesticks.
Using Candlestick Patterns At Support and Resistance Levels
Look for candlestick patterns that form at support and resistance levels. These are important levels where the market has reversed in the past, may do so in the future, and these levels can be used as a launching point to enter a trade in the opposite direction.
How to find support and resistance levels on a chart
Identify the most recent swing high and swing low. The swing high is the highest point that the market reached before it started to fall and the swing low is the lowest point that the market reached before it started to rise.
Draw a horizontal line at the swing high and another horizontal line at the swing low.
The area between the two horizontal lines is called the trading range. The market will often reverse at these levels two levels although you will see, at times, price head back into the range.
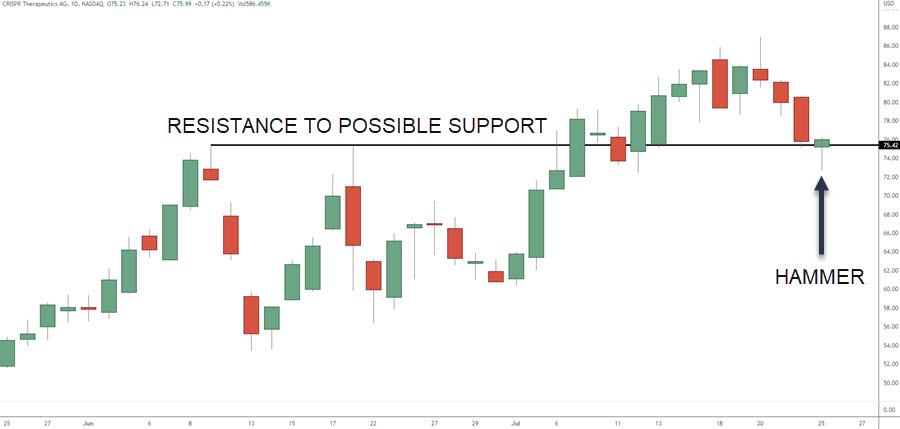
In this example, we have a hammer forming at an area where price had to break through. This is a resistance level turned to support. Traders would look to trade a break of the hammer candle high, stop loss below the low, and implement some type of profit taking plan.
Below, we have a bearish engulfing candlestick at resistance on the daily chart of LEVI forming.

Before taking any action on these candlesticks, you’d want to wait until near the closing of the period to confirm. The downside is that closing price could be far from the high of the candlestick giving you a larger risk profile for the trade.
Combining MACD + Candlesticks + Support/Resistance
You’ve learned how to find and use divergence with the MACD for trading. We’ve covered a few different candlestick patterns you can use along with support and resistance levels. Now, let’s combine them with a trade example using a 15 minute day trading chart.
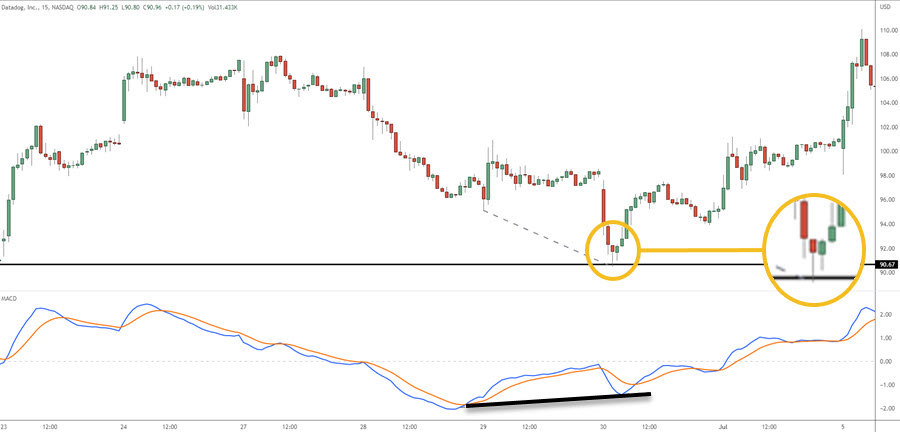
We note price has pulled into a zone that acted as support in the past. The MACD is showing us bullish divergence as price makes a new low. We see a hammer show up at support during bullish divergence. While not a perfect hammer (this is red), the next candlestick gives us a hammer closing green. Entering above the high of those candlesticks and your stop would go below the lows could be your trading plan.
Using Trendlines For Trading
Trendlines are used to identify the direction of the market and can be used as entry triggers in the direction of the trend as we saw in the MACD example.
To draw a trendline, you will need to find at least two points that the stock has touched draw a line connecting those points. If the stock is in an uptrend, you will want to find the most recent low point and connect it to the previous low point. This will give you a upward sloping trendline projected into the future that you can use to look for setups when the stock touches it again.
If the stock is in a downtrend, you will want to find the most recent high point and connect it to the previous high point. This will give you a downward sloping trendline that you can use to find trading opportunities.
The trendline can be used as both a entry and exit tool. For example, if the stock is in an uptrend and breaks a down sloping trendline, you can enter a long trade.
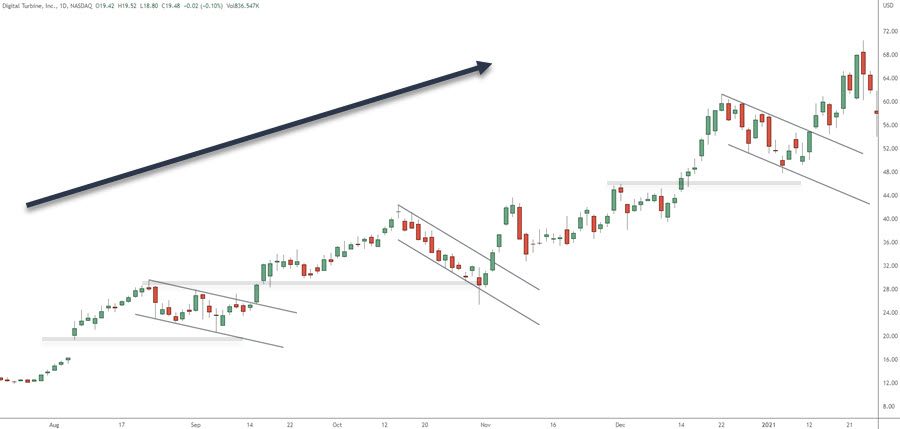
This chart is in an uptrend and we have various pullbacks to areas of interest (the light lines). Traders can combine these trendlines with the MACD divergence and various candlestick patterns to enter trades. Traders can look for hammer candlesticks/bullish engulfing at the bottom of the trend channels as places to enter trades as well.
You can also use multiple trendlines to find more advanced trading opportunities. For example, if the stock is in an uptrend and touches a longer term downward sloping trendline, you could consider a short trade. This is because the stock is still in an uptrend, but may be starting to show signs of weakness. At the very least, you’d want to watch price action for weakness if you are in a long trade.
By using multiple trendlines, you can find more advanced trading opportunities that you might miss if you were only using one trendline.
Conclusion
If you are able to identify bullish divergences and combine them with trendlines, you may be able to find good entry points for trades. This can be a profitable strategy if done correctly, but it is important to place your stop loss carefully and have a target price in mind.
Stay disciplined and don’t enter a trade just because you see a bullish divergence. Make sure that the stock is actually starting to move higher before entering. Otherwise, you may end up taking a loss without any real movement in your direction.
Support and resistance levels are important to watch when trading stocks. These levels can give you an idea of where the stock is likely to find buyers/sellers and may help you to make better trade decisions. Price action can also be a helpful tool in finding these levels. If you see a stock start to bounce off of a certain level, that may be an indication that it is a support or resistance level. Look to the left and see if there is a swing level/price structure that reversed price in the past.
It is important to remember that these levels are not exact and that the stock may trade above or below them at times. However, they can still be useful in giving you an idea of where the stock is likely to go.
FAQ
What is a MACD divergence?
A MACD divergence occurs when the MACD line is making higher lows while prices are making lower lows. This indicates that momentum is starting to shift and that the stock may be ready to move higher.
How do you use MACD divergences to trade stocks?
You can use MACD divergences to trade stocks by looking for a break of the downtrend line. This is where you would enter the trade. The stop loss would be placed below the most recent low and the target price could be set at a prior resistance level.
What are some things to remember when trading with MACD divergences?
Some things to remember when trading with MACD divergences include placing your stop loss carefully and having a target price in mind. It is also important to make sure that the stock is actually starting to move higher before entering a trade. Otherwise, you may end up taking a loss.
What is price action trading?
Price action trading is a type of trading that looks at the movement of prices rather than indicators.
How do you use price action to trade stocks?
You can use price action to trade stocks by looking for support and resistance levels. These levels can give you an idea of where the stock is likely to find support or resistance and may help you to make better trade decisions.
What are some things to remember when trading with price action?
Some things to remember when trading with price action include remembering that these levels are not exact and that the stock may trade above or below them at times. However, they can still be useful in giving you an idea of where the stock is likely to go.
Can this be used with multiple moving averages?
Some traders like the information that three or more moving averages can give them. If you don’t find you get analysis paralysis with too much information, consider testing out using 3 averages.


