- September 21, 2023
- Posted by: Shane Daly
- Categories: Advanced Trading Strategies, Trading Article

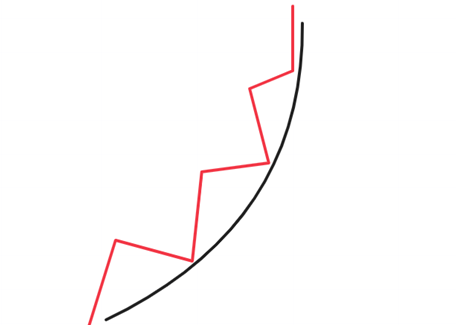
The parabolic candlestick pattern is a classical formation that signals a possible reversal of a bullish trend. The pattern is identified by its visual appearance of an upward-curved trend line with a step-like formation. The pattern occurs during strong bullish trends but is actually a bearish indicator, suggesting that buying pressure becomes exhausted over time. The parabolic curve pattern can be used as a standalone indicator or in conjunction with other technical indicators
 However, it is important to note that it is a bearish indicator, indicating exhaustion in buying pressure.
While you can rely on it for trading decisions, remember that no chart formation is foolproof. Manage your risks by using stop-loss orders and profit targets. You can use the parabolic price pattern alone or pair it with other indicators to increase your chances of success.
Understanding the Basics
The parabolic price pattern is a classic formation that signals a potential shift from a bullish trend, shaped like a parabola.
To master it, you need to be good at:
- Identifying reversal signals
- Calculating profit targets
- Applying risk management techniques
The pattern is a standalone indicator, accurate enough to be used in isolation. It can also be complemented with other technical like Fibonacci retracements for profit target calculation.
Remember, power comes from knowledge. Harness the dependability of the parabolic curve as a reversal pattern, and you’re one step ahead in the trading game.
Recognition Techniques
Start by tracking the bullish trend. Watch for a series of measured pullbacks, which create a step-like structure. Draw a curving trend line beneath these pullback lows, shaping the parabolic arc. Your ability to interpret these signals is key. Remember – it appears during bullish trends, but it’s a bearish indicator.
 The parabolic pattern, with its upward trajectory and step-like formation, is a powerful tool in your trading arsenal. You need to avoid common mistakes in identifying parabolic patterns.
- Don’t misinterpret other robust upward trends as parabolic. They lack the specific curving characteristic.
- Don’t disregard the importance of consolidation and pullback periods in verifying the pattern.
- Don’t neglect the need for a real-time analysis technique for recognizing parabolic patterns.
Differentiating parabolic patterns from other trend formations can help you anticipate the reversal.
Bullish vs. Bearish Indicators
A key thing to remember is that the parabolic curve reversal, despite being a prominent feature during bullish trends, actually signals a potential shift toward bearish market behavior. This unique curve is a testament to the cyclical nature of markets and the power of trading psychology. As buyers push prices up, greed takes over, leading to an unsustainable uptrend.
At this point, the slightest hint of negative sentiment can trigger a sharp sell-off. This is where risk management comes into play.
Traders should be prepared to short the market or exit a long trade, anticipating a potential drop in price. This bearish indicator, despite its emergence from bullish activity, serves as a reminder that the market can turn quickly, and you should be ready to for it.
Parabolic Trading Strategy
Trading the parabolic price pattern involves a strategic approach. Spot the bullish trend and the step-like formation of the pattern.
 Your entry point is selling the currency pair, ETF, or stock when the price breaks beneath the curving trend line. But remember, every trade carries risk. Set a stop-loss order above the pattern’s upper extreme to limit potential losses.
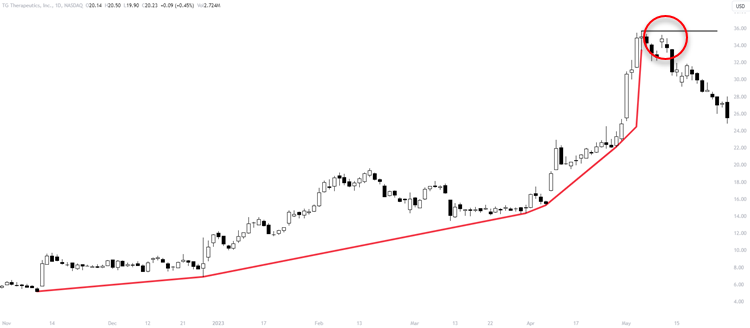
In the example shown, a good entry would be at the retest of the curve high.
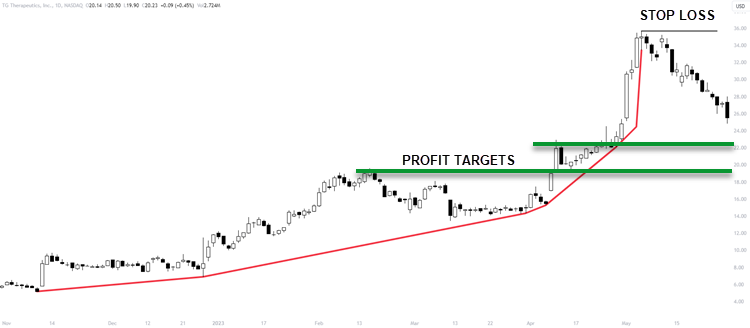 As for profit targets, position them beneath your market entry. Whether you’re using risk vs. reward ratios or Fibonacci retracements, this data-driven approach can help ensure your trading success.
Combining with Other Indicators
You might find it beneficial to pair the arc chart formations with other technical indicators for further confirmation and enhanced trading strategies. Using other indicators in combination with the parabolic price pattern can offer deeper insights, allowing you to capitalize on the best timeframes to trade with the pattern.
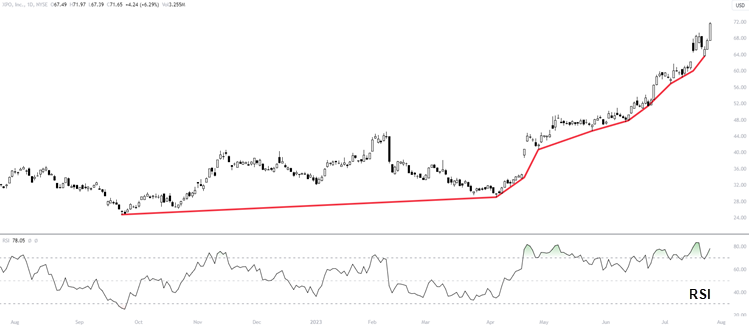
Oscillators such as the Relative Strength Index (RSI) or Moving Average Convergence Divergence (MACD) can provide additional validation of overbought conditions and impending trend reversals.
 Moreover, incorporating risk management techniques when trading the pattern is a must. Employing stop-loss orders and setting appropriate profit targets can protect your capital while maximizing your profit potential.
Remember, no indicator or strategy is infallible, so always trade with caution and discipline.
Frequently Asked Questions
What are some common mistakes traders make when identifying a Parabolic Price Pattern?
One common mistake traders make when identifying a parabolic price pattern is misinterpreting the pattern and mistaking other bullish patterns for it. This can lead to overreliance on patterns and ignoring the overall market context and other essential indicators. It is important to remember that trading decisions should not be solely based on patterns, as they are not always accurate. It is crucial to always consider broader market trends and price action.
How can market volatility affect the accuracy of the Parabolic Price Pattern?
Market volatility can significantly impact the predictability of the parabolic price pattern. Higher volatility can distort the pattern, making it less reliable and potentially leading to false signals. This increases your trading risk. Robust risk management strategies are crucial in these situations to safeguard your investments.
Always consider the volatility impact when using technical patterns, and adjust your strategies accordingly to maintain control in uncertain market conditions.
Can beginners in trading effectively use the Parabolic Price Pattern or is it more suitable for experienced traders?
Absolutely, beginners can effectively use the Parabolic Price Pattern. However, it requires mastering pattern recognition techniques and understanding the limitations of the parabolic pattern. As a novice, you’re prone to misinterpret the pattern or overlook key reversal signals. Having solid risk management strategies in place is crucial.
How does the Parabolic Price Pattern compare to other reversal patterns in terms of reliability?
When comparing pattern formations, the parabolic pattern stands out for its predictability and reliability. It is relatively easy to identify, thanks to its unique curve, making it a valuable tool in your trading strategies.
However, it is important to note that no pattern can guarantee success. It is crucial to exercise prudent risk management when using the parabolic pattern or any other pattern in your trading decisions.
While the parabolic pattern can signal strong reversals and potentially offer high returns, it is ultimately your application of this tool that will either offer you profits or losses.
Conclusion
In trading, the parabolic price pattern is an important tool that should not be overlooked. It can be used to predict potential trend reversals in bullish markets. However, it is important to note that it is not a guarantee, so it is always necessary to practice sound risk management.
To make more accurate predictions, try experimenting with combining the parabolic price pattern with other indicators. By doing this, you can enhance the effectiveness of your trading strategy. Remember, it is not enough to simply recognize the pattern; you must also understand how to effectively use it in your trading strategy.