- August 29, 2022
- Posted by: Shane Daly
- Category: Trading Article
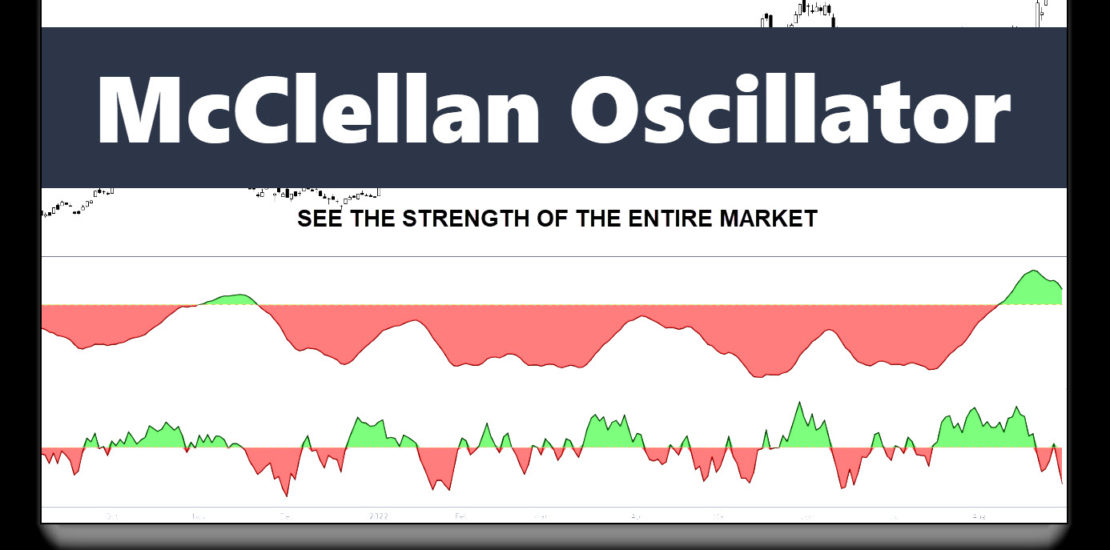
Momentum oscillators are technical indicators that are used to measure the speed and magnitude of price changes. They are typically used to identify overbought and oversold conditions, as well as to spot potential trend reversals. The McClellan Oscillator is a momentum oscillator that takes into account the entire market and not just an individual ticker.
The McClellan Oscillator is used to assess the strength of the market trend. It does this by taking into account the number of advancing and declining stocks, as well as the volume associated with each. By doing so, it is hoped that the McClellan Oscillator will be able to provide traders with a birds-eye view of the overall market and not just an individual sector of the market.
By taking into account the overall market momentum, it is hoped that traders can use that to further increase their edge in the market.
What is the McClellan Oscillator?
The McClellan Oscillator is a market breadth indicator that is the brainchild of Sherman and Marian McClellan that they invented in 1969. The usage of this indicator is geared towards short-term and intermediate-term trading, and it works by tracking the variation between the total number of tickers on the New York Stock Exchange (NYSE) that are either falling or rising.
A bull market is present when more stocks are making significant gains than losses. Traders can use this data to make decisions about the stock market’s current state and health before they put on a position in their favorite ticker.
Why is this important?
There are times when the market is fueled by a handful of big names that can give the impression that the market is strong. Depending on what sector is strong, those tickers could be supporting the overall market as other sectors attempt to drag it down.
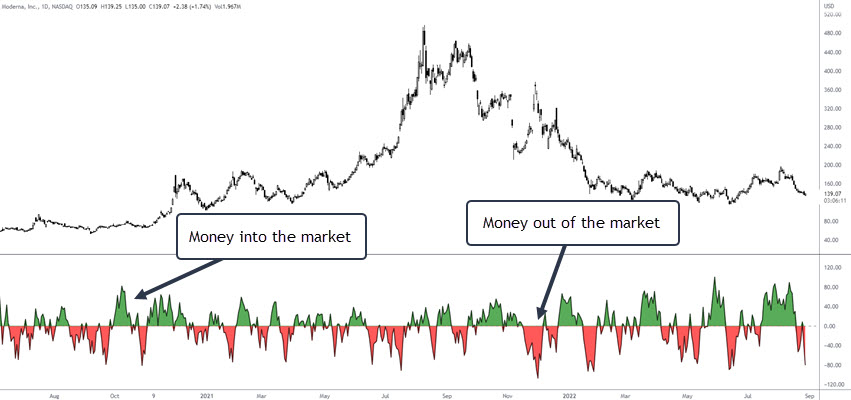
Is more money moving into the market, or is more money exiting the market? Knowing the backdrop of the overall health of the market can lead traders to be more conservative with their trading, or not trade at all.
How can the McClellan Oscillator be used to improve stock trading?
There are two main ways to use and interpret the McClellan Oscillator readings when stock trading: Momentum and oversold/overbought readings.
Momentum Indicator
The McClellan uses two moving averages (39 EMA and 19 EMA) and the calculation involves the advances and declines of the overall stock market. The difference between the two EMA’s is what the oscillator will plot.
If the oscillator is above the zero line (positive), we conclude that, overall, advances are the dominant force in the market.
If the oscillator plots below the zero line (negative), we can conclude that, overall, declines are the dominant force.
From that, we can see if the overall market momentum is bullish or bearish. If the overall market is bearish and you are looking to buy, will you trade the same way as if the market was bullish? Probably not especially from a risk point of view.
Oversold and Overbought Levels
The McClellan Oscillator can be used to show oversold and overbought readings. A reading below -80 is considered oversold, and a reading above 80 is considered overbought. When the market is oversold, it is thought to be due for a rebound. When the market is overbought, it is thought to be due for a pullback.
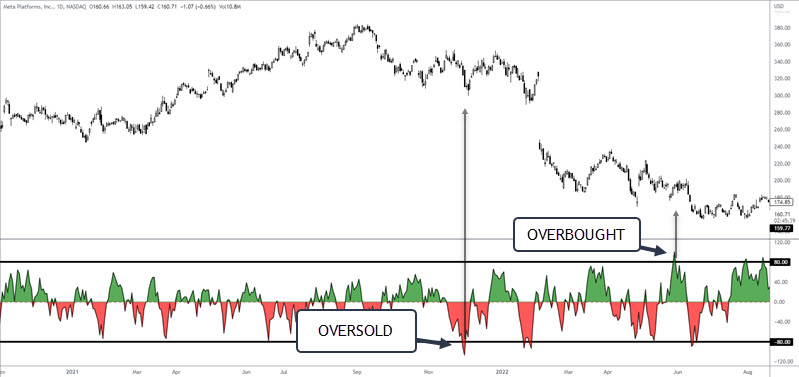
Either of these readings is not an automatic buy signal or a sell signal. You’d still want to ensure that there is a sign that the stock is set to reverse.
As an example, in an overbought reading, a price reversal is not guaranteed. However, if a topping chart pattern or an exhaustion thrust is present, that could lend support to the actual reversal.
Using McClellan Oscillator In A Trading Strategy
The McClellan Oscillator can form part of a stock trading strategy in a few different ways.
One way would be to use the momentum readings from the oscillator to help time entries. If the market is overall bullish (positive), then look for individual stocks that are showing short-term weakness by forming patterns such as bull flags that you can enter off of.
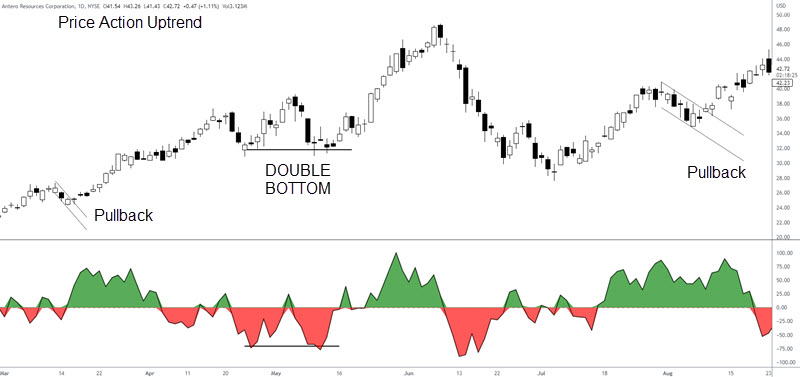
Another way to use the McClellan Oscillator in a trading strategy would be to use oversold/overbought readings. If the oscillator is oversold, look for bullish chart patterns or bullish candlestick patterns to enter the market. If the oscillator is overbought, look for bearish chart patterns or bearish candlestick patterns to enter the market.
In this example, we have a price action downtrend and are taking advantage of price patterns and the overbought readings of the indicator.
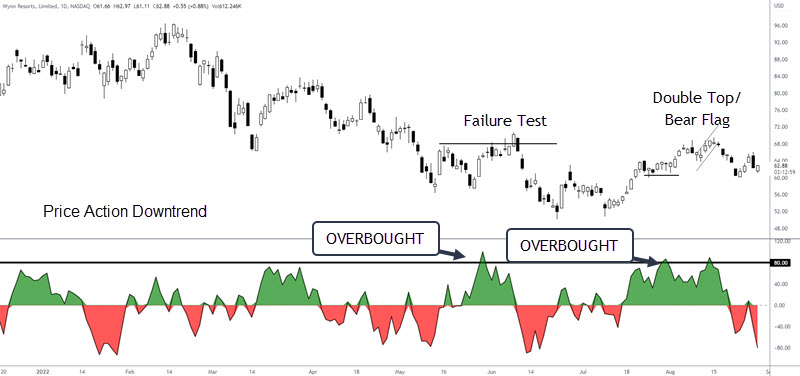
As always, it is important to have a well-rounded and tested trading strategy that takes into account different factors such as risk tolerance, before making any trades.
Remember, the oscillator is showing the momentum of the overall market. You may be looking at a ticker in a sector that is weak and any buy signal may be short-lived. You can’t go wrong by using the price action definition of a trending structure.
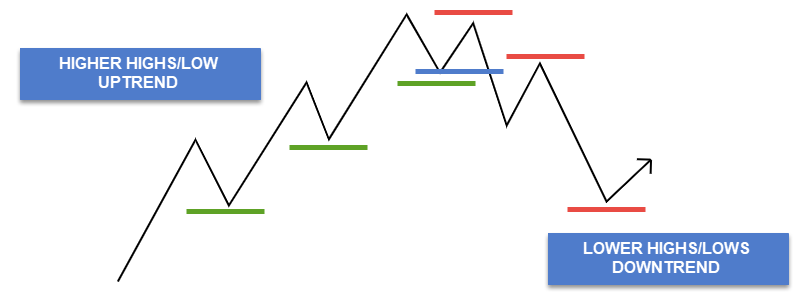
If you are seeing a price structure uptrend in an overall positive market environment, you have a good candidate for a trade to the upside.
McClellan Summation Index
While the oscillator is good, some traders may appreciate this indicator more.
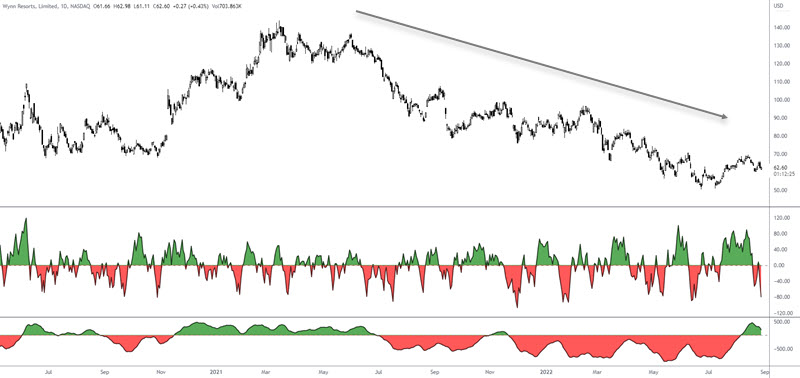
The McClellan Summation Index is a breadth indicator and is a long-term version of the McClellan Oscillator. It is used to gauge the overall strength of the market by taking into account the advancing and declining issues over a period of time – cumulative readings.
Unlike the frequent crossing of the zero line with the basic oscillator as seen above, the MSI gives a better indication of bias over the longer term.
Getting on board a longer-term trend has the potential for massive gains, and using divergence is a viable approach for a heads up that a turn may be happening.
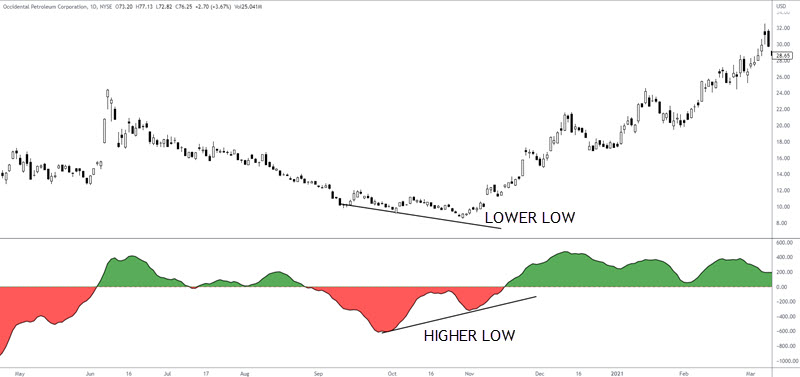
While this stock was drifting lower, we see the McClellan Summation Index make an obvious higher low while the stock price made a lower low. This is bullish divergence and a trader would use one of their entry techniques, if appropriate, to get on board the next move.
Conclusion
While the McClellan Oscillator is not perfect, it is a helpful tool that traders can use to gauge market momentum and identify overbought and oversold conditions.
By taking into account the overall strength of the market, as well as individual stock price action, traders can use the McClellan Oscillator to help time entries and exits in the market.
