- September 17, 2021
- Posted by: CoachMike
- Categories: Options Outlook, Options Trading, Swing Trading, Trading Article

The first 9 months of this year have provided one of the most forgiving markets that traders have ever seen. Every dip has been bought up almost immediately and as a result stocks have spent most of the year grinding towards all-time highs.
However, over the last 2 weeks we have started to see a shift in trading conditions. We are starting to see rallies sold, along with a pickup in volume. While it hasn’t led to any extreme selloffs just yet, the warning signals are all over the place.
While we like to focus on the technical on the charts, which are flashing warning signals, we are also seeing several potential headline risks that have not been priced into the market. All of the following will be hot topics in the months to come:
- Potential for the Fed to begin pulling back on stimulus. The next big Fed meeting is next week where many are expecting them to announce a tapering of their bond purchases.
- Raising the Debt Ceiling will be a big issue in the weeks and months to come. While most would expect them to kick the can further down the road, in today’s climate anything can happen. Bottom line is the level of spending that we have seen from the government is not sustainable. Will this finally start getting priced in?
- The pandemic will also remain a wild card for the economy. As the weather changes and everyone heads back inside, will we see the numbers spike again leading to further restrictions?
Running for the exit is not the strategy just yet, but as traders we can’t ignore the warning signals either. We have been talking to our customers about getting more conservative for the last number of weeks. One of the benefits of trading options is we can control risk easier than any other financial instrument.
Before we talk about the ways we can get more conservative with our options trades, let’s review the technical levels that are giving us the caution signals.
SPY Support Levels
We love to use the S&P 500 ETF (Symbol: SPY) to gauge overall market sentiment. After making yet another all-time high at 454.05 back on 9/1, we have started to see some profit taking kick in. We have seen the last 10 trading days drift to the downside.
Price is now approaching the all-important 50 SMA and EMA levels on the daily chart. These support levels are at 442.51 and 441.94. These moving averages have held as support each time they have been tested so far this year.

We have seen the 50 EMA and SMA levels on the daily chart tested 10 times this year and each time those tests have led to springboard moves back to new all-time highs. Here we are approaching these support levels yet again and if they finally break to the downside, we will be looking for a much deeper pullback to kick in.
Should these levels break on a closing basis, the next support levels below are at 433.55 and 431.12.
Volume
We were expecting volume to pick up after the Labor Day holiday, and that is exactly what we are seeing. For most of the summer months it was a struggle for SPY to trade 50 million shares on a daily basis. Over the last week, we have seen this number jump up to between 75-80 million shares.
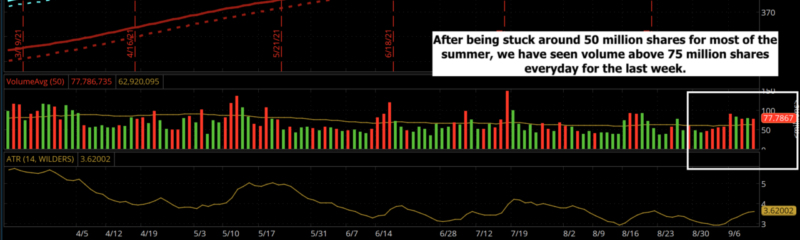
While we would still like to see this number closer to 100 million shares, the jump that we have seen so far have made it much easier to get fills on trades.
The pickup in volume is also another sign that traders are starting to get more active. With stocks so overbought at current levels, we are seeing traders start to get more cautious on the upside and there is more talk of traders starting to take profit.
Average True Range (ATR)
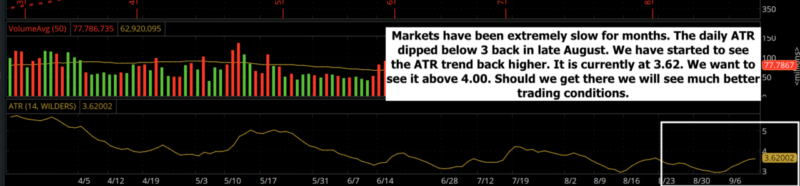
Going back to August, we were seeing the Daily ATR on SPY struggle to get above 3.00. For those of you trading during the summer months, you experienced this slow trading environment. There were many sessions that were like watching paint dry. There just wasn’t much to work with.
As we get into the second half of September, we are seeing the ATR start to expand. It has gone from below 3.00 up to 3.62. The ideal scenario would be to see this number get up above 4.00. Should this happen, we will see much better two-way price action.
While we aren’t looking for the market to crash, this expansion in range is also another sign that traders are more open to the idea of actually selling stocks instead of buying every dip that we see.
VIX
Finally, we are seeing the VIX come to life a bit over the last week. With markets grinding higher for most of the year, the volatility was sucked out of the market. As a result, the VIX contracted down to the low to mid-teens.
For option traders, we want the volatility to stay active. If volatility stays active, our playbook becomes bigger. We are able to use a wider range of option strategies along with a better mix of both weekly and monthly options.
The VIX is currently printing at 19.10. The ideal range would be for this number to be in the mid 20’s. It won’t take much selling in equities to get the VIX in that range. Just another sign that fear is starting to wake back up.
How Do We Handle the Volatility?
Most financial media sources thrive in bull markets and as a result will push that narrative as often as possible. In reality, as active traders we would much prefer to see big moves back and forth. Should we get these warning signals to lead to bigger moves lower, there are some things that we will do to react.
- Credit Spreads – When volatility expands, we prefer to sell more credit spreads. Doing so when options are more expensive will produce better results over time. It allows us to collect more premium up front and push our breakeven points further away from the current stock price.
- Larger Number of Trades – We prefer to take a larger number of small positions when trading options. This allows us to get more diversification by spreading the capital into a larger number of areas. Instead of taking 3-5 bigger positions, we prefer to take 10-15 small positions. This will allow us to use a better mix of strategies on a wider range of markets.
- Risk Management – When markets get active, it’s easy to get caught up in the hype and lose track of risk management. It’s crucial to keep the risk at 2-5% of your account per trade. Any higher than this, and you run the risk of a large drawdown due to a few losing trades.
Instead, we like to use smaller positions on a larger number of markets to produce the results we are looking for. We can then let the power of compounding take over.
Conclusion
The warning signals are there all over the place. We expect the 4th quarter to produce a much different market environment than what we have seen for most of the year so far. Don’t let the volatility expansion intimidate you. If you properly manage your risk with a wide range of options strategies, there are great returns to be made.
2 Comments
Comments are closed.
I purchased the spy lesson from your but never received a lesson per say
Brenda send me an email to mike@netpicks.com so we can help out.