- September 6, 2022
- Posted by: CoachMike
- Categories: Options Trading, Stock Trading, Swing Trading, Trading Article, Trading Indicators
With market volatility again elevated, we are seeing many retail traders falling into the trap of thinking we are now seeing a new normal. I have heard from numerous traders over the last few weeks that have said that technical indicators no longer matter when trading options.
“All that matters is that the Fed controls markets in both directions”
The problem with this line of thinking is that we heard the same arguments last year when markets were zooming higher. Traders were talking how the Fed would rescue the markets at any sign of trouble meaning stocks would head higher indefinitely.
What have we seen in both of these cases?
There is never a new normal.
Markets have always, and will always, move up, down, and sideways. It is crucial to keep the emotions out of your trading as much as possible. Price action on the charts will tell us everything that we need to know about what markets are doing.
Let’s take a look at how focusing on the technical levels on the charts has made a huge difference just recently.
SPY Technical Levels
We have seen big moves in both directions on SPY over the last few months. If we go back to the middle of August, we had markets plowing their way higher off the June lows. We had many stocks that were trading in strong uptrends. This was the point that I started hearing from traders that the downside no longer mattered and that we would get another big move higher.
However, look at the daily SPY chart below and look where price stalled out on 8/16. Was this a random level not associated with any technical levels? No, we touched the 200 period Simple Moving Average (SMA) to the penny.
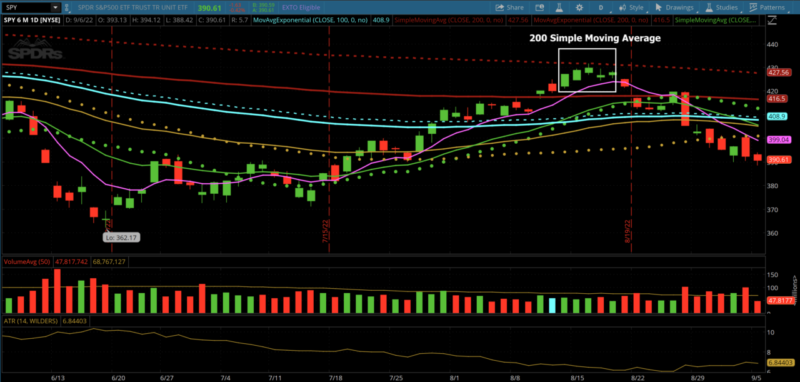
That began another wave lower for many stocks. We tried moving higher again but tested another level of resistance at the 20 period SMA. This wasn’t another random high being put in place. This was a key area of resistance holding again.

Price continued heading lower and has most recently tested a swing low from 7/26 at 390.00. So far, price has respected that support level over the last few days.

During this time we have had the Fed raise interest rates, economic numbers showing signs of a slowing economy, inflation numbers remaining sky high. Price on the charts told us everything that we needed to know about these news headlines.
Do technical indicators matter when trading options?
In our view, technical indicators and patterns can help form an opinion on market direction. They can also provide clues as to which options strategies are best to use. They aren’t the Holy Grail, but can help improve your exponentially.
If we look at a simple Daily Chart of SPY to form an opinion on market direction, it can help me put on the right options positions. While markets were testing the 200 SMA on the daily chart back in August, we had our members positioned for a pullback.
Even though markets were strong at the time, the technicals allowed us to filter out the news cycle and make sure the numbers and statistics were backing our decision making. We were able to initiate bearish positions expecting price to pullback from the overbought conditions that we were seeing.
Limiting the emotional aspect of trading is crucial to becoming a successful options trader. Turning off the news and focusing on the technicals will make you better at your craft. All media sources are focused on pushing the fear narrative. They want eyes on the headlines and if you aren’t careful you will be taking trades based on those headlines.
Instead, we recommend focusing on some key technical indicators for your trading decisions. This will force you to be more disciplined and you will be basing your trading decisions off numbers that make sense long term.
Here is a starting point to help you get some basic technical tools in place to help with your decision making.
We like to track the following moving averages on the daily chart:
Simple Moving Averages:
200 SMA
50 SMA
20 SMA
Exponential Moving Averages:
200 EMA
100 EMA
89 EMA
50 EMA
20 EMA
8 EMA
We are looking for price to test the levels above along with any previous swing highs/lows. These levels can both provide potential entry points or even provide levels of interest where you can take positions off to manage your risk.
Conclusion
Stocks are set to remain volatile for months to come. If you can eliminate the news of the news cycle, there are profits to be made from trading options. You should be able to back up every trading decision that you make with numbers and statistics.
If you can’t, then you are trading off emotion which will lead to inconsistent results. Focus on the price on the charts and it will tell you everything you need to know about how strong or weak the market is.
Ensure you download our free guide about trading Options during volatile conditions. Click here to get your guide