- June 15, 2023
- Posted by: Shane Daly
- Category: Trading Article

Technical analysis plays an important part in reading and understanding price movements. Among the many chart patterns that traders use, the Diamond Chart Pattern stands out as an exciting and potentially powerful pattern for any instrument.
 In this post, we will explore the definition and characteristics of the Diamond Chart Pattern, and how it can be used to improve your trading strategies.
Definition of the Diamond Chart Pattern
The Diamond Chart Pattern is a rare chart pattern that signals a potential reversal in the market trend. It is formed by a combination of four trend lines: two converging trend lines, which create a symmetrical triangle, and two more trend lines that form a broadening formation. The diamond top is considered resistance and the diamond bottom is considered support.
The overall appearance resembles a diamond shape, hence the name.
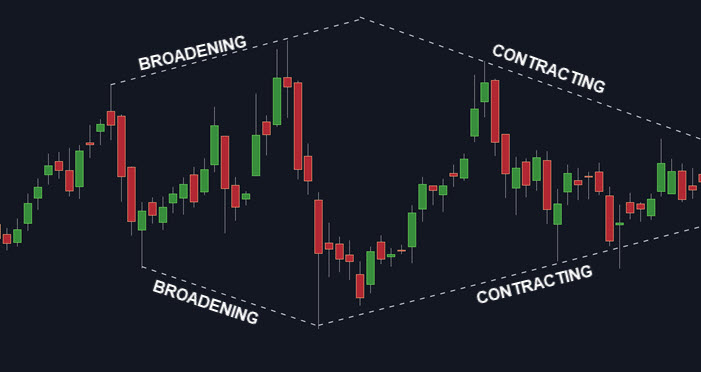 This pattern can be observed in any time frame, from intraday to long-term charts. It can appear at the top or the bottom of a market trend, indicating either a bearish or bullish reversal.
To better understand the pattern, let’s dive into its distinct characteristics.
3 Characteristics of the Diamond Chart Pattern
| Aspect | Description |
|---|---|
| Formation | Two Phases: 1. Widening price range (broadening formation) 2. Contracting price range (diamond shape) |
| Volume | Typically decreases during symmetrical triangle formation. Increases during broadening formation. Increase in volume may confirm pattern’s validity |
| Breakout | Occurs when price breaks one of diamond’s boundaries. Bullish reversal: price breaks above upper trend line. Bearish reversal: price breaks below lower trend line. Breakout may be accompanied by significant increase in volume to confirm validity |
Like all chart patterns, they are not as cleanly formed as some people think. It is the concept of the pattern, why it forms, is what matters.
Identifying the Diamond Chart Pattern
The best way to learn how to identify the pattern on the chart is to remember how it forms.
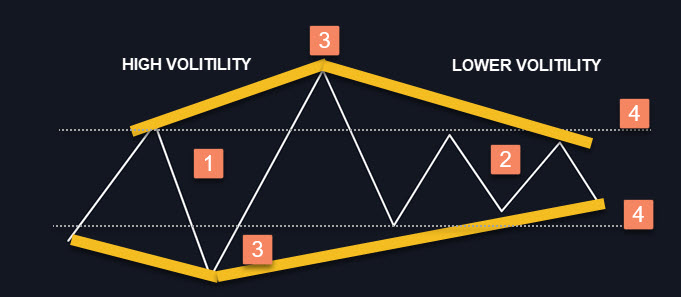
- Broadening Pattern on the Left: The pattern starts as a broadening formation, which is a combination of higher highs and lower lows. This indicates an increase in market volatility.
- Symmetrical Triangle on the Right: The broadening pattern is followed by a symmetrical triangle, which consists of lower highs and higher lows. This indicates that the market is starting to form a consolidation pattern (exact opposite of the left side).
- Two Converging Trendlines: The Diamond Chart Pattern is defined by two converging trendlines, which connect the higher highs and the lower lows. These lines form a diamond shape which is how it got its name
- Horizontal Support or Resistance Line: The pattern is completed when the price breaks through a horizontal support or resistance zone formed within the symmetrical triangle.. This breakout can be a potential trend reversal.
Remember, it doesn’t have to be a perfect pattern.
We are seeing an increase in volatility followed by a consolidation. Eventually, the pattern ends with a symmetrical triangle breakout.
Trading Strategies for the Diamond Chart Pattern
It is not a difficult pattern to spot and when you do, you need a strategy in order to capitalize on it.
Let’s cover some simple ways to set your entry points, stop loss, and profit targets,
Diamond Chart Pattern Core Trading Strategy
At its core, and even with an interesting name, we are trading a breakout from a consolidation pattern.
Here’s a step-by-step guide to the strategy:
- Identify the Diamond Chart Pattern: As discussed earlier, look for the pattern’s key components, including a broadening formation, symmetrical triangle, converging trendlines, and horizontal support or resistance line.
- Wait for a Confirmed Breakout: The breakout through the horizontal support or resistance line is a crucial signal for the Diamond Chart Pattern. Wait for the price to close above (for bullish patterns) or below (for bearish patterns) the horizontal line, confirming the breakout.
- Enter the Trade: Once the breakout is confirmed, enter a trade in the direction of the breakout (long for bullish patterns, short for bearish patterns).
Long Trade Example
Entry Points for Diamond Chart Pattern Trades
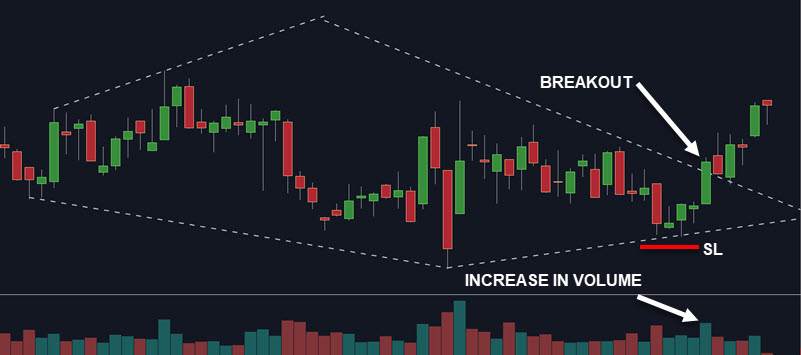
The ideal entry point for a Diamond Chart Pattern trade is shortly after the confirmed breakout. This ensures that the pattern has been validated, and the potential trend reversal is underway.
It is important to note that the breakout should be accompanied by increased trading volume, but not always.
What you want to see after a breakout is continued volume coming into the instrument. I’ve seen breakouts on high volume that collapse on the next bar. Monitor the volume (if it’s part of your strategy) and look to see an increase so you can confirm there is actual interest.
Setting Stop Loss for Diamond Pattern Trades
Proper risk management is crucial when trading this or any other pattern. To set an appropriate stop loss, follow these guidelines:
- Bullish Diamond Formation: Place a stop loss below the recent swing low within the pattern or the horizontal support line, providing enough room for the trade to breathe.
- Bearish Diamond Formation: Place a stop loss above the recent swing high within the pattern or the horizontal resistance line, offering adequate protection against potential false breakouts.
Profit Targets for Diamond Chart Pattern Trades
Setting profit targets for Diamond Chart Pattern trades involves measuring the height of the pattern and using that measurement to project the potential price move.
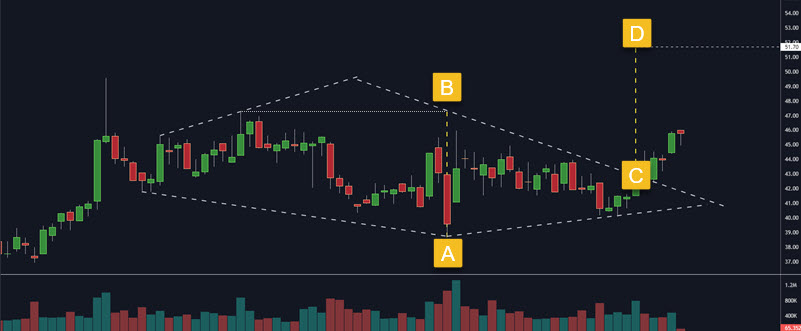
Here’s how to set profit targets for both bullish and bearish patterns:
- Bullish Pattern: Measure the height of the pattern from the highest high to the lowest low (some will measure to the support line). Add this distance to the breakout point.
- Bearish Pattern: Measure the height of the pattern from the lowest low to highest high (some will measure to the resistance line)to the horizontal resistance line. Project from breakout zone.
Our ultimate price target is labelled “D”. These targets are estimates. It is important for you to monitor price during the advance (or decline) as it heads towards your target price.
By implementing these trading strategies, traders can take advantage of the Diamond Chart Pattern’s high reliability and potential trend reversal signals.
Comparing Diamond Pattern to Other Patterns
This pattern, as mentioned, is a consolidation breakout pattern. After price forms the broadening formation on the left side showing volatility increasing, the right side triangle forms shows it decreasing. The pattern can be either bullish or bearish, depending on the direction of the breakout.
While it is unique in its formation, there are other patterns that traders should be familiar with, such as the Bear Flag Chart Pattern, Triangle Chart Pattern, and Double Bottom Pattern. Each of these patterns has distinct characteristics that can help traders identify potential trading opportunities.
The flag and triangle patterns are a form of consolidation like the diamond while the double bottom is a support holding or failing type of setup.
Diamond Chart Pattern VS Head and Shoulders Pattern
The Head and Shoulders Pattern is another well-known chart pattern that signals a trend reversal. It consists of three peaks: a higher peak (head) between two lower peaks (shoulders). The neckline, which is a support level, connects the lows after the left and right shoulders.
While both the Diamond Chart Pattern and Head and Shoulders Pattern indicate potential trend reversals, they have some differences.
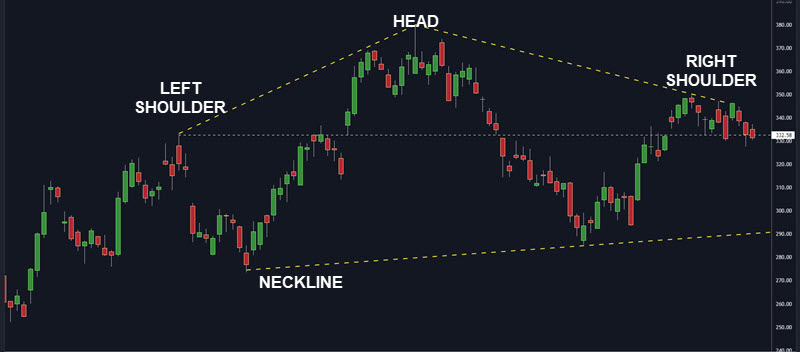 The Diamond Pattern forms a diamond shape, while the Head and Shoulders Pattern resembles a human head and shoulders. The H&S is not a consolidation break but can be classified as a support holding or failing setup while price puts in a lower high.
Additionally, the Diamond Pattern can signal either a bullish or bearish reversal, whereas the Head and Shoulders Pattern is primarily bearish, with its bullish counterpart being the Inverse Head and Shoulders Pattern.
Related Chart Patterns to the Diamond Chart Pattern
While the Diamond Chart Pattern can be useful, it doesn’t appear as often as other ones. Consider adding these into your trading toolbox:
- Triangle Chart Pattern: Triangles, such as ascending, descending, or symmetrical, represent periods of consolidation before a breakout.
- 2-Bar Reversal Pattern: A simple yet effective reversal pattern that consists of two candlesticks with opposite colors and similar heights.
- Forex Reversal Candlestick Patterns: These patterns, such as the Hammer, Shooting Star, and Engulfing Pattern, can help traders identify potential reversals in the foreign exchange market.
- Trading Island Reversals: An uncommon but powerful reversal pattern characterized by a gap before and after the island, indicating a strong shift in market sentiment.
- 3-Bar Reversal Pattern: A more complex reversal pattern involving three consecutive bars, signaling a potential change in the trend direction.
For most traders, pick one or two patterns and use those as the main focus of your approach to trading. Become an expert at those patterns and build your trading strategy around those.
Pros and Cons of The Diamond Chart Pattern
Trading is not an exact science and there are good and bad with any approach. Chart patterns can be subjective which is why I mentioned understanding the concept of what the pattern is showing. In the case of the Diamond pattern, it’s just a consolidation after a period of volatility.
| Pros | Cons |
|---|---|
| Rare but reliable | Takes practice to identify since it does not always form perfectly |
| Clear entry and exit points | Consolidated breakouts fail |
| Can be used with various timeframes and markets | Subjectivity – different traders may see the pattern differently or not at all, leading to different results with the same approach |
| Versatility – can be used in stocks, forex, commodities, and cryptocurrencies, making it a valuable tool for many traders | Requires experience and skill to use effectively |
| Can help identify trend reversals and continuations | May not work in all market conditions |
Frequently Asked Questions
How can I trade diamond chart patterns effectively?
To trade diamond chart patterns effectively, first identify the pattern’s formation on a price chart, then enter a trade in the direction of the breakout with a well-defined stop-loss and profit target.
What does the diamond pattern signify in trading?
The diamond pattern signifies a potential trend reversal, providing valuable insights into the market’s direction.
Does the diamond chart pattern indicate a bullish or bearish trend?
The diamond chart pattern can indicate either a bullish or bearish trend, depending on the direction of the breakout from the pattern.
How dependable is the diamond pattern?
The diamond pattern is considered reliable when it occurs but it is crucial to apply proper risk management techniques to mitigate potential losses from false breakouts or misinterpretation.
Is it possible to generate profits trading diamond patterns?
It is possible to generate profits trading diamond patterns, but traders must employ sound strategies, risk management, and discipline to ensure consistent results.
How can one master trading chart patterns like an expert?
To master trading chart patterns like an expert, develop a understanding of various patterns and why they form, practice identifying them, and use proper risk management techniques
Conclusion
By practicing finding these patterns and using smart ways to manage risks, traders can take advantage of changes in market trends and improve their overall trading results. Just like any other trading method or technical analysis pattern, being consistent, disciplined, and always learning are key to being successful in trading.
