- May 25, 2023
- Posted by: Shane Daly
- Categories: Cryptocurrencies, Trading Article, Trading Indicators

To conquer cryptocurrency trading with Bollinger Bands, traders need to understand the principles of Bollinger Bands, including how to interpret the upper, middle, and lower bands. Traders should also learn how to use Bollinger Bands in combination with other technical indicators to identify potential trading opportunities and manage risk effectively.
 Cryptocurrency traders can greatly increase their chances of success by utilizing Bollinger Band strategies. In this article, we’ll explore what Bollinger Bands are, how they work, and the different types of Bollinger Band strategies that can be used to maximize profits.
With the right knowledge, strategy and discipline, you can conquer crypto trading with Bollinger Bands.
What Are Bollinger Bands
Bollinger Bands are a powerful technical analysis tool developed by John Bollinger in the 1980s. They help traders identify periods of high and low volatility in financial markets, including cryptocurrencies.
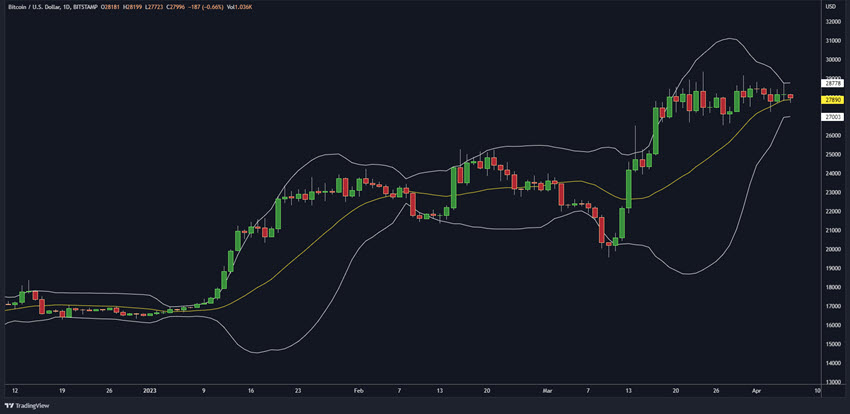
Bollinger Bands have become widely popular among traders and investors alike, because of their effectiveness in predicting potential price movements and their ability to adapt to various market conditions.
Basic components and calculations
Bollinger Bands consist of three key components:
| Band | Description | Calculation |
|---|---|---|
| Middle Band | Moving average that serves as the basis for the upper and lower bands. | Calculated as a simple moving average (SMA) or an exponential moving average (EMA) over a specific period, typically 20 days. |
| Upper Band | Calculated by adding a specific number of standard deviations (usually 2) to the middle band. | Upper Band = Middle Band + (2 x Standard Deviation) |
| Lower Band | Calculated by subtracting a specific number of standard deviations (usually 2) from the middle band. | Lower Band = Middle Band – (2 x Standard Deviation) |
These bands help traders determine the current price’s position relative to its historical price movements, offering insights into potential trend reversals or continuations.
Types of Bollinger Bands (Simple, Exponential)
There are two primary types of Bollinger Bands based on the type of moving average used in their calculations:
- Simple Bollinger Bands: These use the simple moving average (SMA) as the middle band, which calculates the average price over a specific period.
- Exponential Bollinger Bands: These use the exponential moving average (EMA) as the middle band, which gives more weight to recent price movements, making it more responsive to changes in price.
Both types of Bollinger Bands serve the same purpose, but the choice between them depends on a trader’s preference and the characteristics of the market they are trading.
Understanding Volatility
Volatility refers to the degree of variation in an asset’s price over time. High volatility indicates rapid and significant price fluctuations, while low volatility signifies relatively stable price movements. Understanding volatility is important for cryptocurrency traders because it allows them to assess risk, identify trading opportunities, and optimize their trading strategies.
How Bollinger Bands measure volatility
Bollinger Bands measure volatility by analyzing the width between the upper and lower bands. As the bands expand, it indicates increasing volatility, suggesting that the market is experiencing more significant price fluctuations.
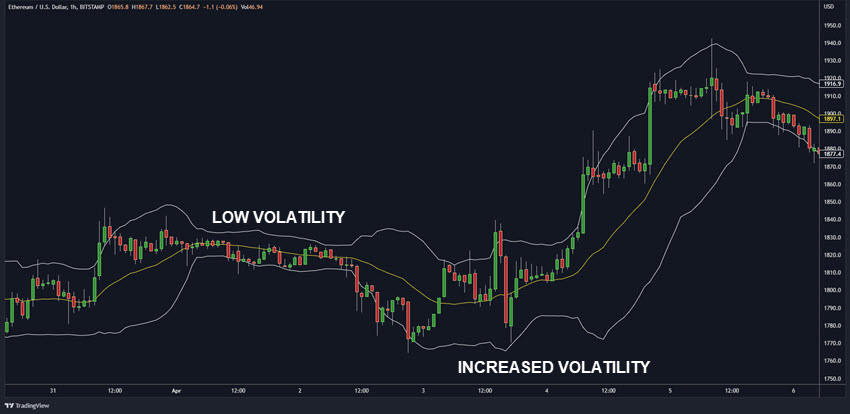
On the flip side, as the bands contract, it signals decreasing volatility, which implies that the market is relatively stable.
This relationship between Bollinger Bands and volatility allows traders to spot potential trend reversals or periods of market consolidation, providing valuable information to inform their trading decisions.
Examples of volatile and non-volatile cryptocurrency markets
A volatile cryptocurrency market might experience rapid price swings, such as Bitcoin during the 2017 bull run, where its price rose from around $1,000 to nearly $20,000 within a year. In this scenario, the Bollinger Bands would expand, reflecting the heightened volatility.

On the other hand, a non-volatile cryptocurrency market may exhibit more gradual price movements, such as stable coins like Tether (USDT) or USD Coin (USDC), which are pegged to a reserve of assets like the US dollar. In these cases, the Bollinger Bands would contract, indicating a low-volatility environment.
By understanding and utilizing Bollinger Bands effectively, cryptocurrency traders can make better decisions to capitalize on trends and volatility, maximizing their potential profits and minimizing risks.
Using Bollinger Bands for Trading Cryptocurrency
Using Bollinger Bands for trading cryptocurrency involves analyzing the upper and lower bands to identify periods of high and low volatility, anticipate price movements, and detect potential trend reversals or continuations.
Setting up Bollinger Bands on a cryptocurrency chart
To set up Bollinger Bands on a cryptocurrency chart, follow these steps:
[✓] Choose a charting platform that supports Bollinger Bands, such as TradingView or Coinigy.
[✓] Open a cryptocurrency chart and select the desired time frame.
[✓] Locate the Bollinger Bands indicator in the platform’s list of available tools.
[✓] Apply the Bollinger Bands to your chart, adjusting the settings (e.g., moving average type, period, and standard deviations) according to your preferences.
How to interpret Bollinger Band signals (Squeeze, Breakout, Reversal)
There are several Bollinger Band signals that traders can use to make a decision on whether to trade or not.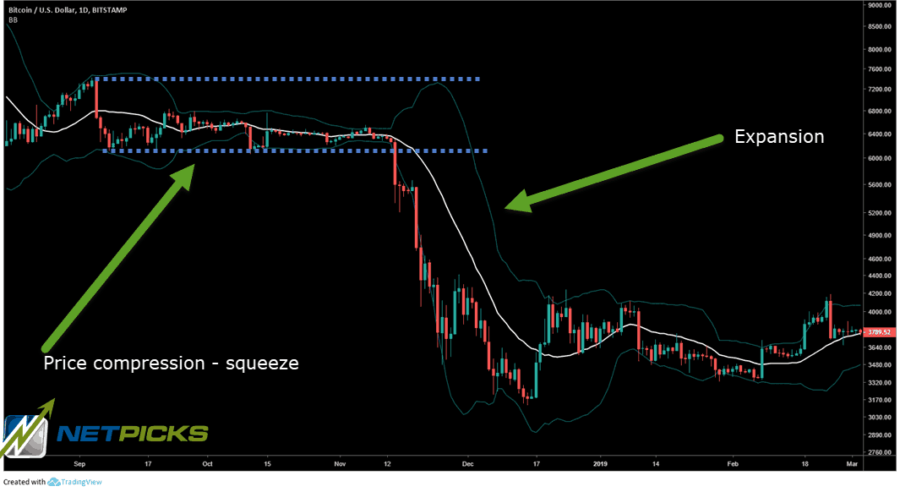 Squeeze: When the bands contract significantly, it indicates a period of low volatility, known as a “squeeze.” A squeeze often precedes a significant price movement, or “breakout,” in either direction.
Breakout: When the price moves above or below the bands after a squeeze, it signals a potential breakout. Traders may take a long or short position depending on the direction of the breakout.
Reversal: When the price touches or moves outside of the bands, it may indicate an overbought or oversold condition, suggesting a potential trend reversal. Traders can look for confirmation from other indicators to validate the reversal signal.
Bollinger Band Trading Strategies
There are many ways to use this indicator for trading cryptocurrency. The bottom line is we look for changes in volatility and when price gets extended to or through the bands, we look for mean reversion (retracing price action) to trade.
Scalping with Bollinger Bands
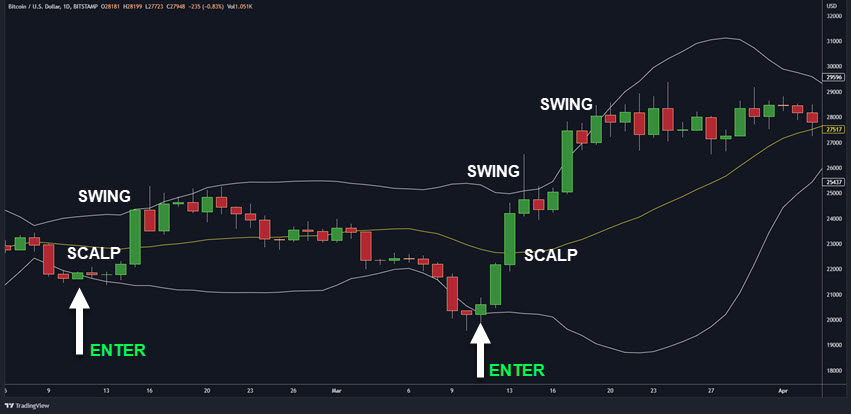
Scalping is a short-term trading strategy that involves making multiple small, quick trades to profit from small price movements. Traders can use Bollinger Bands for a scalping strategy by entering a trade when the price touches the outer bands and exiting when it reaches the middle band. This strategy works best in a ranging market with consistent volatility.
 Swing trading with Bollinger Bands
Swing trading is a medium-term trading strategy that aims to capitalize on larger price swings. Bollinger Bands can help swing traders identify trend reversals and potential entry and exit points.
For example, traders can enter a long position when the price bounces off the lower band and price support and shows signs of upward momentum, and exit when the price reaches the upper band.
Combining Bollinger Bands with other technical indicators
For increased accuracy and effectiveness, traders can combine Bollinger Bands with other technical indicators, such as the Relative Strength Index (RSI), Moving Average Convergence Divergence (MACD), or Stochastic Oscillator.
Consider using support and resistance zones as well as certain chart patterns like double bottoms, various triangles, and flags.
These additional indicators/price patterns can confirm Bollinger Band signals, reducing the likelihood of failed trades and improving overall trading performance.
Common Challenges and Risks
False signals and whipsaws
Like any technical analysis tool, Bollinger Bands can generate signals that produce bad setups, leading to potential losses. Whipsaws, or sudden price reversals, can be particularly challenging for traders relying solely on Bollinger Bands.
To mitigate this risk, traders should use additional indicators/price action for confirmation and ensure that strict risk management strategies are followed.
Over-Reliance on Bollinger Bands
While Bollinger Bands can be a valuable tool, it’s important not to rely on them exclusively.
Successful traders combine Bollinger Bands with other technical and sometimes fundamental analysis methods to form a robust trading strategy.
By incorporating a range of tools and techniques, traders can develop a robust approach to cryptocurrency trading and reduce the impact of any single indicator.
Risk management and stop-loss strategies
One of the critical aspects of successful trading is effective risk management. When using Bollinger Bands, it’s essential to implement stop-loss strategies to protect your capital from significant losses in case the market moves against your position.
A common stop-loss approach with Bollinger Bands is to place a stop order just beyond the opposite band from your trade entry. For example, if you enter a long position near the lower band, you could place a stop-loss order slightly below the lower band.
Another risk management technique is to set a trailing stop order that moves with the market, locking in profits as the price moves in your favor. This strategy can help you maximize gains while minimizing losses, ensuring that you maintain a positive risk-reward ratio.
Real-world Examples
To illustrate the practical application of Bollinger Bands in cryptocurrency trading, let’s look at two case studies:
Case Study 1: Bitcoin (BTC) Breakout in 2020
In the second quarter of 2020, Bitcoin experienced a significant breakout, which Bollinger Bands helped to identify. In May, the bands contracted, indicating a “squeeze” and signaling an impending price movement.
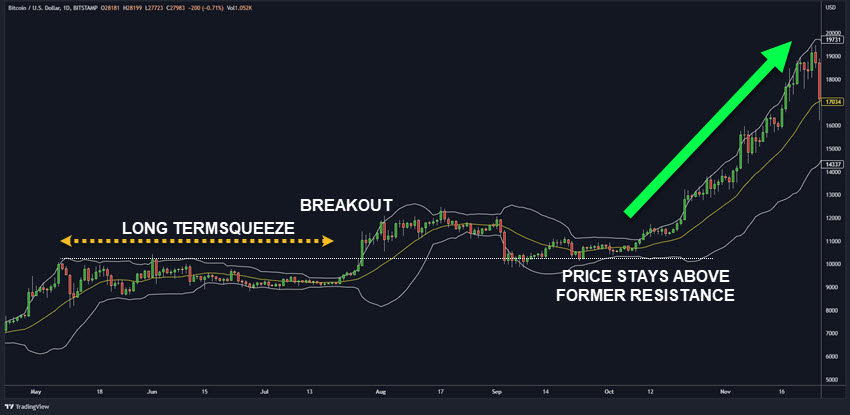
By late July, Bitcoin’s price broke above the upper band, suggesting a bullish breakout. Traders who identified this signal and entered a long position could have profited from the subsequent price increase, as Bitcoin’s value surged from around $9,200 to over $12,000 within a few weeks.
Case Study 2: Ethereum (ETH) Reversal in 2021
In early 2021, Ethereum experienced a strong uptrend, reaching a peak in mid-May. Bollinger Bands proved useful in identifying a potential trend reversal at this point.
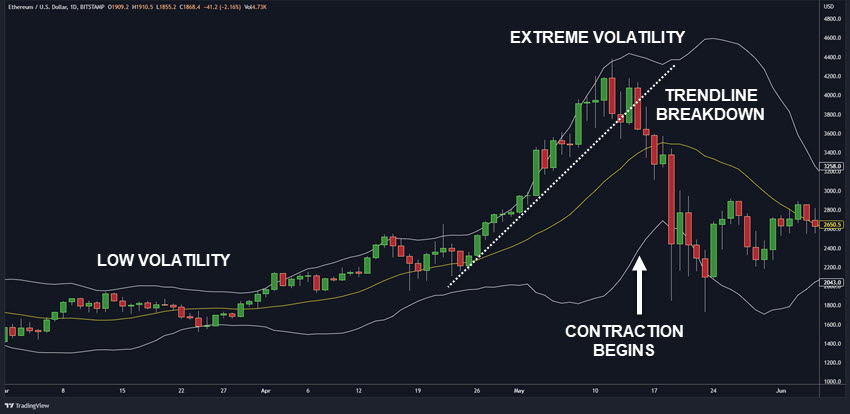
As the price approached the upper band, the bands began to contract, signaling decreased volatility and possible exhaustion of the uptrend. When Ethereum’s price dropped below the middle band, it confirmed a bearish trend reversal.
Traders who recognized this signal and entered a short position could have profited from the subsequent price decline, as Ethereum’s value fell from around $4,300 to under $1,800 by mid-July. Using a standard trendline break along with the extended price action could get you short earlier than a middle band break
These real-world examples and historical analyses demonstrate the power of Bollinger Bands in identifying trends, reversals, and breakouts in cryptocurrency markets. These events play out on any time time frame and any cryptocurrency you may trade.
By understanding how to interpret Bollinger Band signals and combining them with other technical indicators and risk management strategies, traders can enhance their decision-making process and increase their chances of success in the volatile world of cryptocurrency trading.
Conclusion
Bollinger Bands are a powerful and versatile tool for cryptocurrency traders, providing valuable insights into market volatility, trends, and potential trading opportunities. By understanding the basics of Bollinger Bands, learning how they measure volatility, and applying them effectively in various trading strategies, you can enhance your decision-making process in the fast-paced world of cryptocurrency trading.
Be aware of the common challenges and risks, such as false signals and overreliance on a single indicator. By combining Bollinger Bands with other technical indicators and implementing solid risk management strategies, you can increase your chances of success.
Real-world examples and historical analyses demonstrate the practical application and effectiveness of Bollinger Bands, encouraging traders to explore their potential and take action based on the knowledge gained from this post.
Common Questions
What are Bollinger Bands in cryptocurrency trading?
Bollinger Bands are a technical analysis tool that helps traders identify periods of high and low volatility in financial markets, including cryptocurrencies, by using moving averages and standard deviations to create upper and lower bands.
How do Bollinger Bands measure volatility?
Bollinger Bands measure volatility by analyzing the width between the upper and lower bands. Expanding bands indicate increasing volatility while contracting bands signal decreasing volatility.
What are the key Bollinger Band signals?
The key Bollinger Band signals are squeeze (contracting bands indicating low volatility), breakout (price moving above or below the bands after a squeeze), and reversal (price touching or moving outside the bands, suggesting a trend reversal).
How can I combine Bollinger Bands with other technical indicators?
Combine Bollinger Bands with indicators like RSI, MACD, or Stochastic Oscillator to confirm signals, reduce false signals, and improve overall trading performance.
How can I implement risk management when using Bollinger Bands?
Implement risk management by using stop-loss strategies, such as placing a stop order beyond the opposite band from your trade entry or setting a trailing stop order that moves with the market to protect your capital.
