- November 3, 2023
- Posted by: Shane Daly
- Categories: Trading Article, Trading Tutorials
Are you ready to take your trading strategy to the next level? In this comprehensive guide, we will delve into the concept of trading confluence and how it can enhance your trading decisions. By mastering the art of trading confluence, you will be able to identify key entry and exit points, analyze technical indicators, and make better trading decisions.

Key Takeaways:
- Confluence in trading refers to the coming together of multiple factors or indicators to support a trading decision.
- Analyzing price action and technical indicators is crucial to identify areas of confluence in the market.
- Evaluating fundamental factors and market sentiment can provide additional confirmation for trading confluence.
- Assessing the risk-to-reward ratio helps determine the attractiveness of a trade with confluence.
- Combining the findings from analysis and making informed decisions based on confluence can increase the probability of success.
Understanding Confluence in Trading
Confluence in trading refers to the convergence of multiple factors or indicators that support a trading decision. These factors can include price patterns, support and resistance levels, trendlines, technical indicators, fundamental factors, and market sentiment. By identifying and analyzing the confluence of these factors, traders can make more informed trading decisions and increase the probability of success.
When analyzing confluence in trading, traders look for instances where multiple factors align and provide confirmation or convergence. For example, if a price pattern indicates a potential trend reversal, and a technical indicator also signals a change in momentum, it adds weight to the trading decision. The more factors that align, the stronger the confluence and the higher the probability of success.
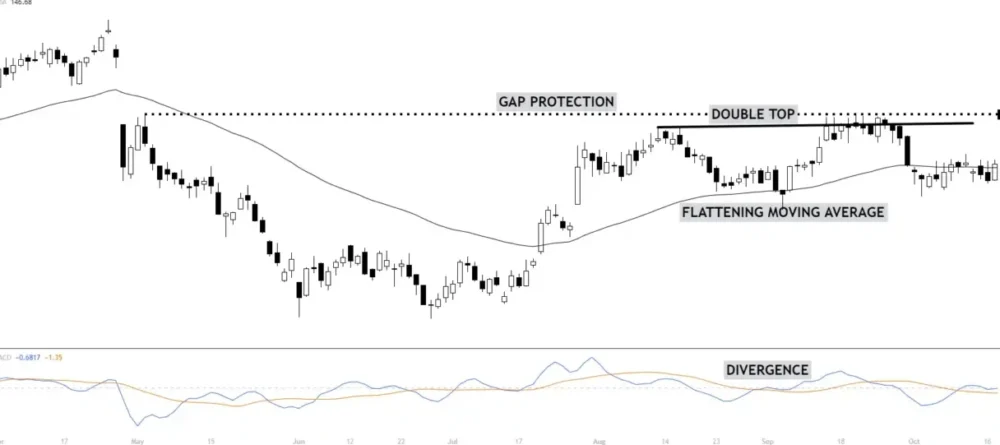
Another example is if a support level coincides with a trendline and a moving average, it creates a strong zone of confluence. This suggests that multiple factors are signaling a potential turning point in the market.
| Factors | Examples |
|---|---|
| Price Patterns | Head and Shoulders, Double Top/Bottom |
| Support and Resistance | Horizontal levels, Trendlines |
| Technical Indicators | Moving averages, MACD, RSI |
| Fundamental Factors | Economic data, News events |
| Market Sentiment | Investor sentiment surveys, Volatility indices |
Understanding confluence in trading requires a combination of technical analysis, fundamental analysis, and market sentiment evaluation. By incorporating these different factors into your decision-making process, you can improve their trading strategies and increase the likelihood of successful trades.
Identifying the Trading Setup
The first step in trading confluence is to identify the trading setup. This involves determining the specific criteria for your desired setup, whether it’s a trend reversal, breakout, or pullback. By having clear parameters in mind, you can focus your analysis and effectively identify potential areas of confluence.
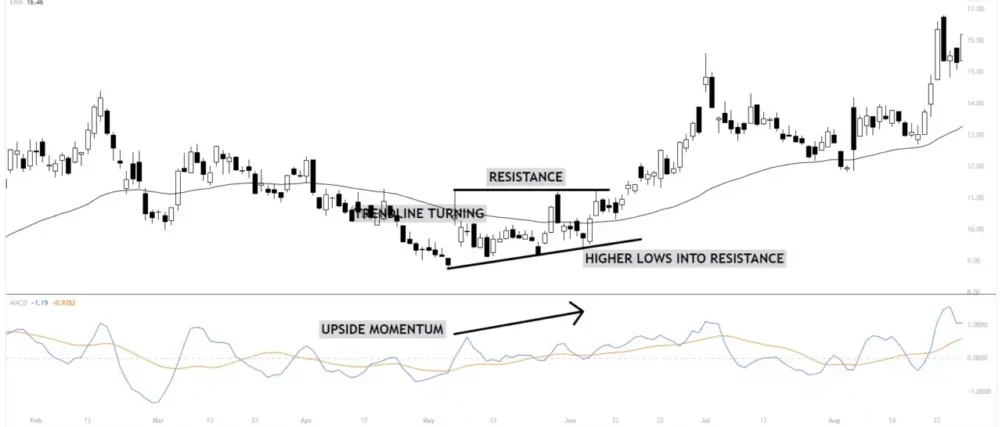
For example, if you’re looking for a trend reversal, you might consider analyzing candlestick patterns, such as double tops or bottoms, as well as trendline breaks. These indicators can signal a potential change in market direction and provide confluence for your trading setup.
| Types of Trading Setups | Criteria | Indicators |
|---|---|---|
| Trend Reversal | Candlestick patterns, trendline breaks | Double tops or bottoms, trendline breaks |
| Breakout | Key support or resistance levels, consolidation patterns | Breakouts above resistance or below support levels, chart patterns |
| Pullback | Retracement levels, trendline bounces | Fibonacci retracement levels, trendline bounces |
By clearly defining the trading setup you’re interested in and analyzing the relevant indicators, you can effectively identify areas of confluence and enhance the probability of a successful trade. Remember to adapt your criteria and indicators based on the specific market conditions and assets you’re trading.
Analyzing Price Action and Indicators
This step involves closely examining the price chart for relevant patterns and utilizing technical indicators that align with your trading strategy. By identifying instances where multiple indicators and price patterns provide confirmation or convergence, you can strengthen your trading decisions and increase the probability of success.
Price action analysis involves studying the movement of prices on the chart to identify patterns such as support and resistance levels, trendlines, and chart patterns. These patterns can provide valuable insights into potential entry and exit points for your trades. Additionally, technical indicators such as moving averages, oscillators, and volume indicators can be utilized to further validate your trading decisions.
For example, you might observe a bullish reversal candlestick forming at a key support level while the Stochastic oscillator indicates oversold conditions. This confluence of price action and technical indicator signals could suggest a high-probability trade setup.
| Price Action | Technical Indicators |
|---|---|
| Support and resistance levels | Moving averages |
| Trendlines | Oscillators |
| Chart patterns | Volume indicators |
Incorporating both price action analysis and technical indicators can provide a comprehensive view of the market and help you identify areas of confluence. Remember that confluence is not about relying on a single indicator or price pattern but rather the convergence of multiple factors that support your trading decision.
Evaluating Fundamental Factors and Market Sentiment
When it comes to trading confluence, it’s essential to evaluate both fundamental factors and market sentiment to make informed decisions. Fundamental factors include economic data, news events, and geopolitical developments that can have a significant impact on the financial markets. By staying updated, you can identify potential areas of confluence and make better trading decisions.
 One crucial aspect of evaluating fundamental factors is understanding how they align with your technical analysis. For example, if you’re analyzing a potential breakout trade, a positive news event or strong economic data that supports the anticipated breakout can increase the probability of success. Conversely, if there are fundamental factors that contradict your technical analysis, it may be wise to reassess the trade or wait for more favorable conditions.
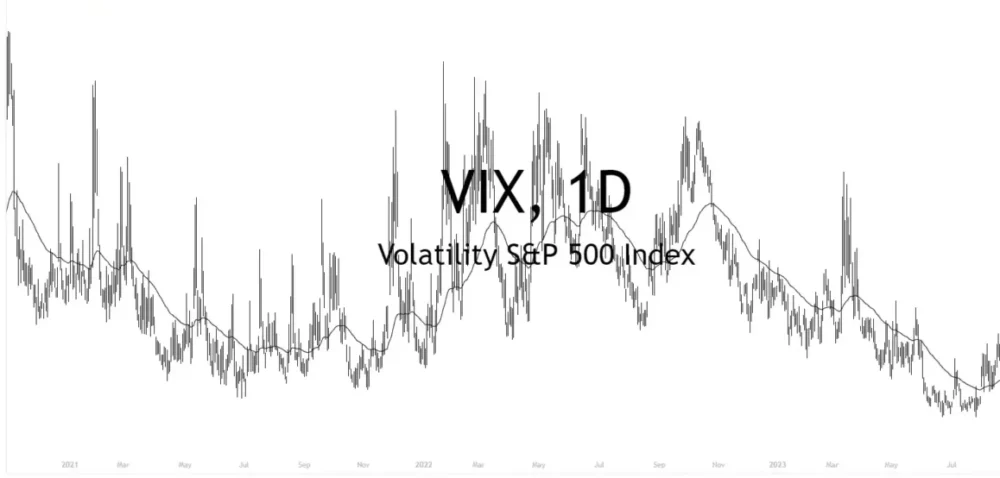
Market sentiment indicators are another important tool for evaluating confluence.
- Consumer Confidence Index: This indicator measures the confidence and optimism of consumers regarding the state of the economy. A higher consumer confidence level often suggests stronger consumer spending and a more positive outlook on the market.
- Volatility Index (VIX): Also known as the “fear gauge,” the VIX measures the market’s expectations for future volatility. When the VIX is high, it typically indicates that investors are nervous or uncertain about the market, while a low VIX may signal complacency.
- Put-Call Ratio: This ratio compares the number of put options (bearish bets) to call options (bullish bets) being traded in the options market. A high put-call ratio can indicate increased bearish sentiment, while a low ratio may suggest a more bullish outlook.
These indicators provide insights into the overall mood and sentiment of market participants. By assessing whether market sentiment aligns with your trading setup and analysis, you can gain additional confirmation for your trade. For example, if you’re considering a bullish trade and market sentiment is overwhelmingly positive, it can provide further validation for your analysis.
Assessing Risk-to-Reward Ratio
When it comes to trading, assessing the risk-to-reward ratio is essential for making informed decisions. The risk-to-reward ratio is a measure of the potential loss compared to the potential gain in a trade. By evaluating this ratio, you can determine whether a trade is worth taking, based on the potential reward justifying the risk involved.
Confluence plays a role in assessing the risk-to-reward ratio. When multiple factors align and support your trading setup, it increases the likelihood of a successful trade and improves the risk-to-reward ratio. The more factors that confirm your trading decision, the stronger the confluence and the more attractive the risk-to-reward ratio becomes.
Assessing the risk-to-reward ratio is not a guarantee of success. It provides insights into the potential profitability of a trade. By considering the confluence of factors and evaluating the risk-to-reward ratio, you can make decisions that align with your trading strategy and risk tolerance.
Risk-to-Reward Ratio Calculation
| Trade Setup | Entry Price | Stop Loss Level | Target Price | Potential Risk | Potential Reward | Risk-to-Reward Ratio |
|---|---|---|---|---|---|---|
| Breakout Strategy | $50 | $45 | $60 | $5 | $10 | 1:2 |
| Pullback Strategy | $75 | $72 | $85 | $3 | $10 | 1:3.33 |
In the example table above, we showcase the calculation of the risk-to-reward ratio for two trading setups: a breakout strategy and a pullback strategy. The breakout strategy has an entry price of $50, a stop-loss level of $45, and a target price of $60. This results in a potential risk of $5 and a potential reward of $10, leading to a risk-to-reward ratio of 1:2.
On the other hand, the pullback strategy has an entry price of $75, a stop loss level of $72, and a target price of $85. The potential risk in this trade is $3, while the potential reward is $10, resulting in a risk-to-reward ratio of 1:3.33.
Monitoring and Adjusting the Trade
Once you enter a trade based on confluence, your work is not done. It is crucial to regularly monitor the price action and reassess the confluence of factors to ensure that the trade remains favorable. By keeping an eye on the market conditions and the performance of your trade, you can effectively manage and adjust your position as needed.
Monitoring the trade involves tracking the price movement, observing any changes in key indicators, and paying attention to any news or events that may impact the market. This active monitoring allows you to stay informed and make informed decisions based on real-time information.
When monitoring your trade, it is important to have clear criteria for making adjustments or considering an exit. This could include predefined profit targets, trailing stops, or specific price levels at which you will reassess the trade. By having these criteria in place, you can make rational decisions rather than emotional ones, which can help protect your capital and maximize profits.
| Monitoring and Adjusting the Trade Checklist |
|---|
| Regularly monitor the price action and key indicators |
| Stay informed about market conditions and news events |
| Have clear criteria for making adjustments or considering an exit |
| Consider using profit targets and trailing stops |
Remember, market conditions can change rapidly, and remaining adaptive is crucial. By monitoring your trade and adjusting as necessary, you can respond to any shifts in the market and protect your profits. Continuously reassessing the confluence of factors will allow you to stay one step ahead and make the most of your trading opportunities.
Conclusion
Trading confluence is a powerful trading approach that can help maximize your profits in any market. By identifying and analyzing multiple factors and indicators that support your trading decision, you can make more informed and successful trades.
Remember that confluence is not a guaranteed method for success. It is important to practice proper risk management and have a well-defined trading plan in place. While confluence increases the probability of success, there is always a level of uncertainty in trading.
Remember to stay disciplined, regularly monitor your trades, and adjust your strategy as needed. As you gain experience and refine your approach, trading confluence can become an invaluable tool in your trading arsenal.
FAQ
What is confluence in trading?
Confluence in trading refers to the coming together of multiple factors or indicators that support a particular trading decision. It increases the probability of a successful trade by providing a stronger signal.
How can I determine confluence in trading?
To determine confluence in trading, you should identify the trading setup you are interested in, analyze price action and technical indicators, evaluate fundamental factors and market sentiment, assess the risk-to-reward ratio, combine all the findings, make an informed decision, and regularly monitor and adjust the trade.
Is confluence a guarantee of a successful trade?
No, confluence is not a guarantee of a successful trade but rather an indication of higher probability.
What factors can contribute to confluence in trading?
Factors that can contribute to confluence in trading include price patterns, support, and resistance levels, trendlines, technical indicators, fundamental factors, and market sentiment.
How do I identify the trading setup for confluence?
Identify the trading setup by determining the specific criteria for your setup, including patterns, indicators, or price levels that you are interested in.
What should I analyze to identify confluence in the market?
Analyze price action and technical indicators by examining the price chart for relevant patterns and applying technical indicators that align with your trading strategy.
How can I evaluate fundamental factors and market sentiment for confluence?
Evaluate relevant fundamental factors that may impact the market or the specific asset you are trading, and assess market sentiment indicators to determine if market sentiment aligns with your trading setup and analysis.
How do I assess the risk-to-reward ratio for a trade?
Evaluate whether the potential reward justifies the risk involved and consider the alignment of multiple factors for confluence to increase the attractiveness of the risk-to-reward ratio.
How do I combine findings for confluence in trading?
Compile all the factors and indicators that support your trading setup and look for areas of confluence where multiple factors align, confirming the same trading decision.
How do I make an informed decision with confluence?
Based on the confluence of factors, make an informed decision about whether to take a trade, considering the overall strength of confluence and the level of confidence it provides.
How often should I monitor and adjust the trade?
Regularly monitor the price action and reassess the confluence of factors, making adjustments or exiting the trade if the confluence weakens or market conditions change.
Can trading confluence guarantee success?
While trading confluence increases the probability of successful trades, it is not a guarantee of success. Always practice proper risk management and have a well-defined trading plan.
Unlock Your Trading Potential!
Trading Indicator Blueprint
Discover the secrets behind popular trading indicators like
Moving Averages, Keltner Channels, Stochastics, MACD, and more.
While others might charge $197 for these insights, we’re offering it to you for FREE!
50+ Pages
4 Professional Videos
Actionable Trading Systems