- January 2, 2025
- Posted by: Shane Daly
- Categories: Trading Article, Trading Indicators
The Choppiness Index is one of the most intriguing technical analysis tools developed in modern trading history. Created by Bill Dreiss in the early 1990s, this indicator transformed how traders evaluate market conditions by quantifying the difference between trending and choppy markets on a scale of 0 to 100. While many technical indicators focus only on price direction or momentum, the Choppiness Index addresses a fundamental question that affects every trading decision: Is the market truly trending, or is it moving sideways in a volatile, choppy pattern?
TLDR
- The Choppiness Index, developed by Bill Dreiss in the 1990s, measures market conditions on a 0-100 scale to identify trending versus choppy markets.
- Values below 38.2 indicate strong trends suitable for breakout strategies, while values above 61.8 suggest choppy, range-bound market conditions.
- The index incorporates True Range, Period Length (typically 14 days), and ATR Sum to calculate market volatility and movement patterns.
- It serves as a lagging indicator that helps traders determine appropriate strategies, with lower values favoring trend-following and higher values supporting range trading.
- The tool works effectively across multiple timeframes and complements other technical indicators like Bollinger Bands and Moving Averages for comprehensive analysis.
What Is The Choppiness Index
Determining market trends with is the primary function of the Choppiness Index, a technical analysis tool created by Australian commodity trader Bill Dreiss. This innovative indicator helps us understand whether a market is trending or moving sideways, operating on a scale from 0 to 100, where lower values signal trending conditions and higher values indicate choppiness.
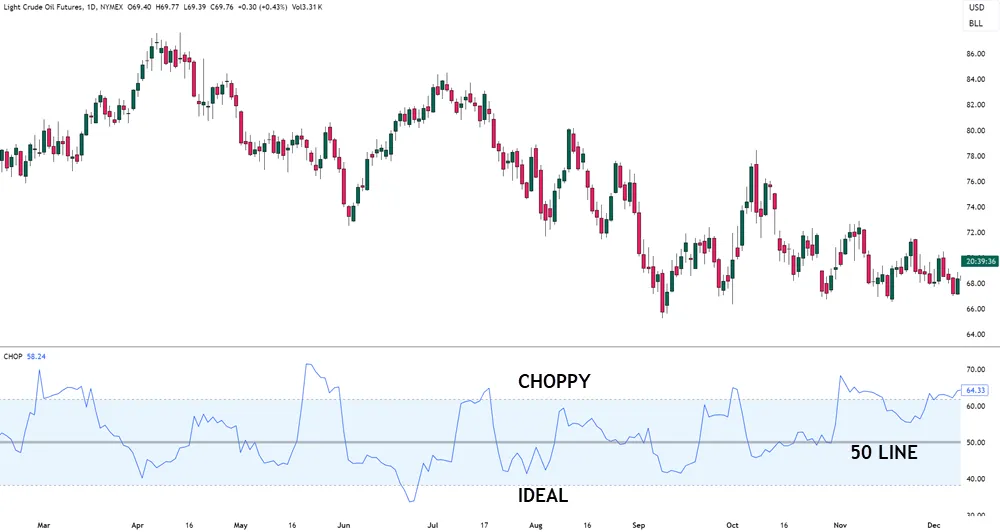
When I look at markets using this tool, I pay particular attention to two important Fibonacci thresholds: 38.2 and 61.8. Values below 38.2 typically confirm a strong trend in progress, while readings above 61.8 suggest we’re in choppy, range-bound conditions. Maintaining smaller risk percentages across multiple trades can help navigate these market conditions effectively.
You’ll see this tool is particularly valuable for assessing market volatility and directional momentum. The index’s calculation incorporates the Average True Range and price extremes over a specified period, providing a comprehensive view of market behavior.
What makes this indicator especially practical is its versatility across different timeframes. Whether you’re day trading with one-minute charts or swing trading with hourly intervals, the Choppiness Index adapts to your trading style while maintaining its reliability.
Combining the Choppiness Index with moving averages and MACD can provide stronger confirmation of trend changes and potential trading opportunities.

Origins and Development
The index was first introduced in Dreiss’s book, “The Trader’s Edge,” and gained attention after its publication in the July/August 1992 edition of Commodity Traders Consumer Report.
The Choppiness indicator came from Dreiss’s recognition of the limitations in existing trend indicators. He created a sophisticated but still a practical solution by using Fibonacci range numbers (38.2 and 61.8) to distinguish between trending and consolidating market trends.
The calculation methodology involves analyzing the relationship between true ranges and the overall price range over a specified period.
What makes this indicator particularly valuable is its adaptability across different timeframes and market conditions. While the default setting is 14 days, I’ve found that traders can adjust these parameters to suit their specific needs.
The index’s development marked a significant advancement in technical analysis, providing traders with a more reliable tool for determining whether to implement trend-following strategies or remain cautious during consolidation phases.
The indicator works effectively when combined with MACD signals to confirm potential trend reversals and market momentum shifts.
Understanding The Basic Formula
The Choppiness Index formula combines several mathematical components to measure market volatility and trend strength effectively. I’ll break down the basic components into simple parts, starting with the core elements that make this indicator distinctively powerful for traders.
The formula utilizes true range calculations, period specifications, and logarithmic functions to normalize results.
| Component | Function | Application |
|---|---|---|
| True Range | Measures price volatility | Daily high-low, high-prev close, low-prev close |
| Period Length | Defines calculation window | Typically 14 days |
| ATR Sum | Accumulates volatility data | Sums True Range over specified period |
| Price Range | Captures total movement | Highest high minus lowest low |
| Log Function | Normalizes results | Creates 0-100 scale |
The formula explanation becomes clearer when we examine how these elements work together. When we calculate CI = 100 * LOG10(∑ ATR(n) / (MaxHigh(n) – MinLow(n))) / LOG10(n), we’re essentially measuring how choppy or trendy the market is. The higher the result, the more choppy the market; the lower, the more trendy it becomes.
This mathematical relationship provides traders with a reliable gauge of market conditions.
Market Conditions and Signals
Now that you know the mathematical foundation of the Choppiness Index, we can now look at its signals across different market conditions. As I’ve seen in my years of trading, understanding these signals is important for adapting to varying levels of market volatility and maintaining sound trading psychology.
When the index shows low values (0-38.2), we’re dealing with a strongly trending market where directional movement dominates. I’ve found that breakout strategies work particularly well here, as prices tend to maintain their path as you trade in the trending direction.
On the flip side of that, high values (61.8-100) signal a choppy, range-bound market where mean-reversion strategies become more effective.
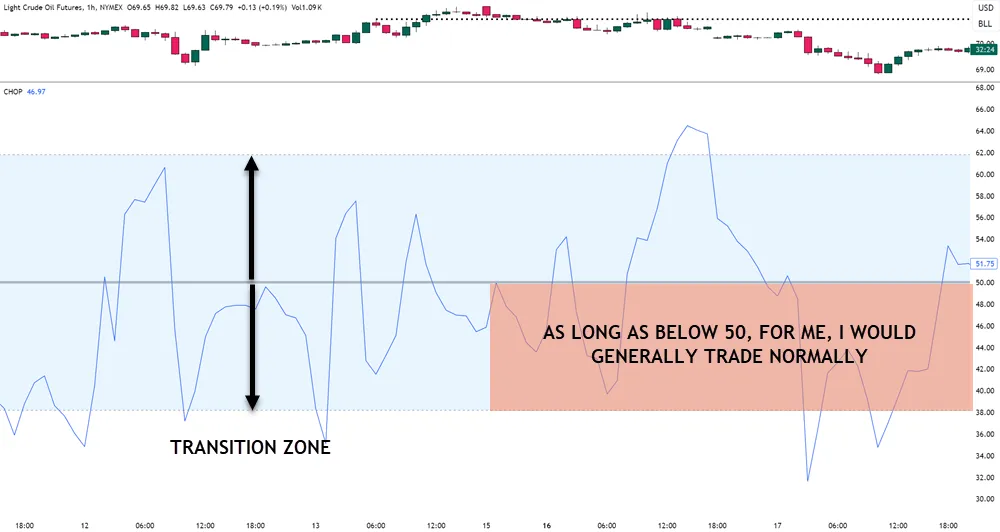
The transitional zone (38.2-61.8) is where many traders, myself included, exercise extra caution. This range indicates market indecision, requiring us to remain flexible and alert to changing conditions. I generally will be extra cautious above 50 because indicators are lagging.
I’ve learned that successful trading during these periods often means reducing position sizes and avoiding aggressive breakout plays. This is where knowing your setup becomes very important.
Maintaining emotional resilience becomes especially vital during choppy market conditions when losses are more likely to occur.
Trading With Choppiness Index
Mastering the Choppiness Index requires an approach that adapts to different market conditions and trading styles. I’ve found that successful traders effectively combine this indicator with various trading strategies to capitalize on both trending and ranging markets.
| Market Condition | Strategy Type | Key Implementation |
|---|---|---|
| Trending (<38.2) | Trend Following | Enter with breakouts, use momentum indicators |
| Ranging (>61.8) | Range Trading | Trade between support and resistance levels |
| Exhaustion (<20) | Reversal Trading | Look for divergence and pattern confirmation |
When I analyze market trends, I focus on using the Choppiness Index to identify ideal entry and exit points. In trending markets below 38.2, I recommend implementing trend-following strategies with momentum indicators for confirmation.
During choppy periods above 61.8, I switch to range trading tactics, utilizing Bollinger Bands and horizontal support/resistance levels.
For scalping opportunities, particularly in markets showing high choppiness values, I’ve found success using shorter timeframes and quick entry/exit points, combined with technical indicators like RSI or MACD for additional confirmation signals.
Key Benefits For Traders
The Choppiness Index offers traders multiple significant advantages in their market analysis and decision-making processes. Through comprehensive Market Observations, traders can effectively distinguish between trending and ranging markets, enabling them to adapt their strategies accordingly and optimize their trading approach.

The indicator gives you an objective way to measure of the different types of market conditions.
I’ve found that Strategy Optimization becomes significantly more achievable when you understand how to use the index’s capabilities. The tool does well in helping you assess market volatility, identify potential trend reversals, and determine appropriate entry and exit points for your trades.
When combined with other technical indicators, such as moving averages and Bollinger Bands, the Choppiness Index provides a good framework for market analysis.
What I particularly value about this indicator is its contribution to risk management. By providing clear signals about market conditions and volatility levels, you can make more informed decisions about position sizing and stop-loss placement.
This comprehensive approach to market analysis helps you maintain a disciplined trading strategy while adapting to changing market conditions. Similar to Bill Williams’ Alligator, this indicator proves most effective when traders monitor multiple timeframes from daily charts down to 15-minute intervals.
Common Issue and Challenges
Despite its value, traders must be aware of a few things when using the Choppiness Index. One of the most common mistakes is treating the index as a predictive tool, when it’s actually a lagging indicator that reflects past price movements.
I’ve observed many traders falling into this trap, leading to misguided trading decisions and potential losses.
The analysis limitations of the Choppiness Index become obvious during market transitions and periods of extreme volatility. In my experience, the index can generate false signals when markets shift between trending and choppy conditions, while static thresholds often prove inadequate across different market environments.

Relying only on the index without considering other factors like market sentiment, news events, and support/resistance levels can be detrimental to your trading strategy.
Also, the index’s effectiveness varies significantly across different markets and timeframes. I’ve noticed that its complex calculation method can lead to interpretation errors, especially when traders don’t fully understand how market-specific conditions impact the readings. You need to fully understand what any indicator is telling you.
You must recognize these challenges and adjust your approach accordingly.
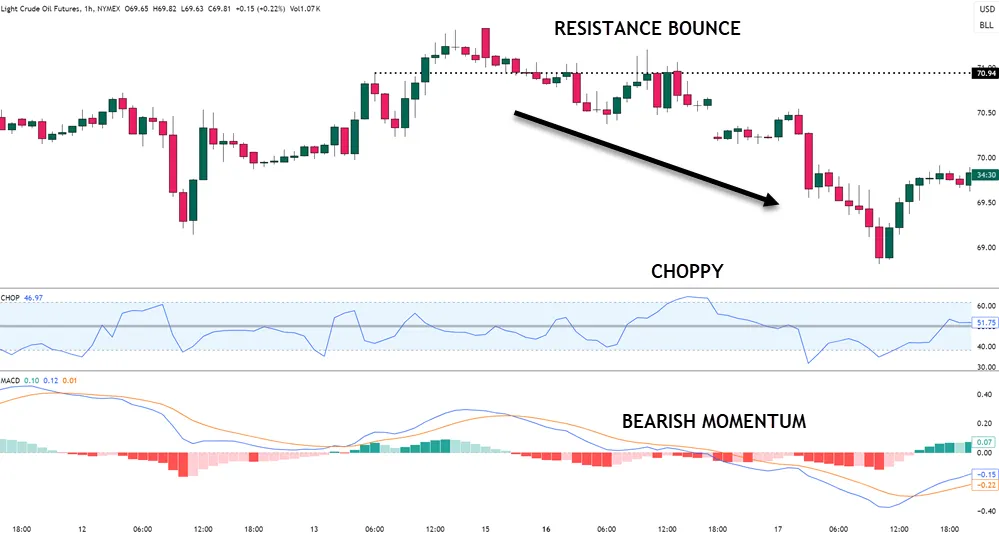
Simplified Crude Oil Trading Strategy
This trading strategy for crude oil incorporates the Choppiness Index (CHOP) and trend line breaks to create a straightforward approach for identifying entry and exit points. CL is one of our preferred day trading instruments.

1. Market Analysis
Conduct a basic analysis of the crude oil market, focusing on:
- Fundamental Factors: Monitor OPEC announcements, geopolitical events, and inventory reports that can impact oil prices.
2. Indicators Used
- Choppiness Index (CHOP): A CHOP value above 61.8% indicates a choppy market, while a value below 38.2% suggests a trending market.
- Simple Moving Average (SMA): Use a 50-day SMA to identify the overall trend direction.
3. Entry Strategy
- Long Entry:
- Ensure the CHOP is below 38.2%, to no greater than 50 indicating a trending market.
- Confirm that the price is above the 50-day SMA, signaling a bullish trend.
- Look for a break above a downward trend line OR consolidation, which indicates a potential upward momentum.
- Enter a long position when the price breaks above a recent resistance level.
- Short Entry:
- Ensure the CHOP is below 38.2%, to no greater than 50 indicating a trending market.
- Confirm that the price is below the 50-day SMA, signaling a bearish trend.
- Look for a break below an upward trend line OR consolidation, which indicates potential downward momentum.
- Enter a short position when the price breaks below a recent support level.
4. Exit Strategy
- Take Profit: Set a target profit level based on recent support and resistance levels, aiming for a risk-reward ratio of at least 1:2.
- Stop Loss:
- For long positions, place a stop-loss just below the most recent swing low.
- For short positions, place a stop-loss just above the most recent swing high.
5. Risk Management
- Position Sizing: Risk no more than 1-2% of your trading capital on a single trade.
- Review and Adjust: Regularly assess your trades and adjust your strategy based on performance and market conditions.
Your Questions Answered
Does the Choppiness Index Work Equally Well in All Financial Markets?
While the Choppiness Index functions across various financial markets, its effectiveness can vary based on market-specific characteristics.
I’ve observed that it tends to work more reliably in markets with consistent volatility patterns, like major forex pairs and large-cap stocks.
However, in markets with irregular trading volumes or extreme volatility spikes, such as small-cap stocks or certain commodities, the indicator may require additional validation and context.
Can the Choppiness Index Be Effectively Combined With Elliott Wave Theory?
Yes, I find the Choppiness Index works effectively with Elliott Wave Theory, particularly in validating wave counts and trend transitions.
While Elliott Wave Interpretation can be subjective, the Choppiness Index provides objective data to support wave analysis.
However, we must consider Choppiness Index Limitations, such as its lagging nature, when combining these tools.
Together, they offer a more sturdy framework for analyzing market structure and potential reversals.
How Does Currency Volatility Affect Choppiness Index Readings in Forex Trading?
Currency fluctuations directly influence Choppiness Index readings, as increased market volatility typically leads to higher index values.
When currency pairs experience significant price swings, the True Range component of the index expands, pushing readings toward the upper threshold of 61.8.
This volatility impact often signals a more choppy, range-bound market condition, making it important for traders to adjust their strategies and potentially avoid trend-following approaches.
What’s the Optimal Timeframe to Use When Day Trading With Choppiness Index?
For day trading, I’d look at focusing on 1-minute to 5-minute charts as your ideal settings, with 15-minute timeframes serving as confirmation.
These shorter intervals allow you to quickly identify market transitions and execute precise trading strategies. While longer timeframes provide context, the rapid nature of day trading demands quick reactions to changing conditions, making shorter timeframes most effective for immediate decision-making.
Does Market Capitalization of Stocks Influence the Accuracy of Choppiness Index?
While market capitalization doesn’t directly affect the Choppiness Index‘s accuracy, it can influence stock volatility patterns that the index measures.
I’ve observed that larger-cap stocks typically display more stable price movements, which may result in clearer index signals, while smaller-cap stocks’ heightened volatility can create more erratic readings.
However, the index’s mathematical formula remains equally valid regardless of market influence.