- August 21, 2023
- Posted by: Shane Daly
- Categories: Basic Trading Strategies, Trading Article

To trade a Bullish Piercing Line Pattern, follow these steps:
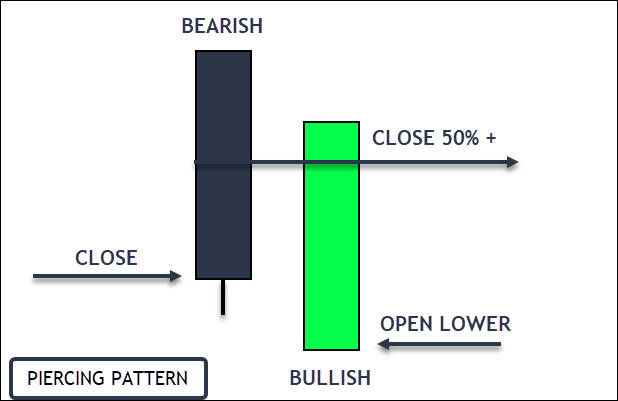
- Identify the pattern: It appears during a downtrend and consists of a long bearish (red or black) candle followed by a bullish (green or white) candle. The second candle opens lower than the first one’s low but closes more than halfway up the first candle’s body.
- Confirmation: Look for confirmation of a trend reversal on the next candle. This could be another bullish candle or a gap up.
- Entry point: Once the pattern is confirmed, consider entering a long position at the opening of the next candle.
- Stop-loss: Set a stop-loss order below the low of the bullish candle in the pattern to limit potential losses if the price reverses.
- Take profit: Set a target price for taking profit. This could be a resistance level or a predetermined return based on your risk/reward ratio.

Always test your strategy before putting money on the line.
Introduction to the Bullish Piercing Line Candlestick Pattern
One of the most significant bullish signals is the Bullish Piercing Line pattern, which can indicate a potential reversal from a bearish trend.
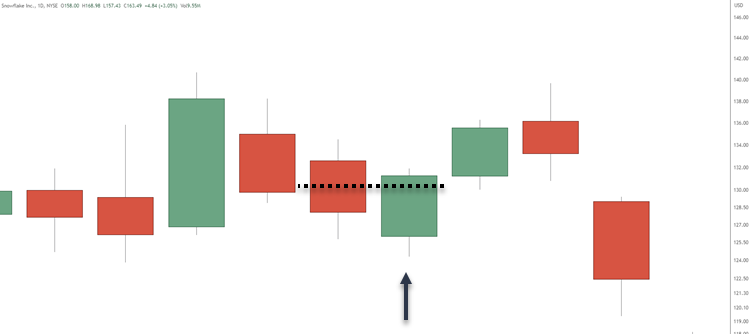
This pattern consists of two candles, with the first one being red and long and the second one being green and opening below the low of the previous day but closing above its midpoint.
If you’re not familiar with candlestick patterns, they’re used by traders to analyze price action and determine potential trends in the market. The bullish piercing line candlestick pattern consists of two candles. The first is a long red (or bearish) candle, followed by a long green (or bullish) candle that opens below the low of the previous day but closes above the midpoint of the first day’s body. The second day’s close should be at least halfway up the first day’s body.
This pattern can signal a shift in market psychology from bearish to bullish sentiment and may indicate that buyers are starting to dominate sellers.
How to Identify and Recognize the Bullish Piercing Line Pattern
Identifying and recognizing a certain bullish signal in the stock market is important to find good setups. One signal is the bullish piercing line candlestick pattern, which indicates a potential trend reversal from bearish to bullish.
 To recognize this pattern, you need to look for two specific candles in a row:
- The first candle should be a long red or black candle that signifies a downtrend in the market. It should have a long body with little to no upper shadow and close near its low point.
- The second candle should open below the low of the previous day but close above its midpoint. It should have a long white or green body with little to no lower shadow and close near its high point.
If these conditions are met, you have identified a bullish piercing line pattern. This pattern suggests that buyers are starting to regain control of the market and that there may be an upcoming uptrend.
Recognizing and understanding the bullish piercing line pattern is essential because it can help traders make better decisions when buying or selling stocks. By identifying this pattern, traders can potentially enter into profitable trades earlier than those who do not recognize it.
Knowing how to identify this pattern can help traders avoid taking positions during bearish trends and instead wait for potential reversals towards more favorable bull markets.
Significance of the Bullish Piercing Line
This ‘piercing’ of the first day’s body signals a potential shift in trader sentiment from bearish to bullish. Traders often see this pattern as a buying opportunity, anticipating that the uptrend will continue.
One of the best times to get into a trade is when the trend has turned. While not always possible to catch the start, getting in before the “meat of the move” is finished is vital for profitable trading. However, as with all trading patterns, it’s important to consider this signal in the context of other market indicators to confirm the reversal.
Real-life Example of Bullish Piercing Line Candlestick
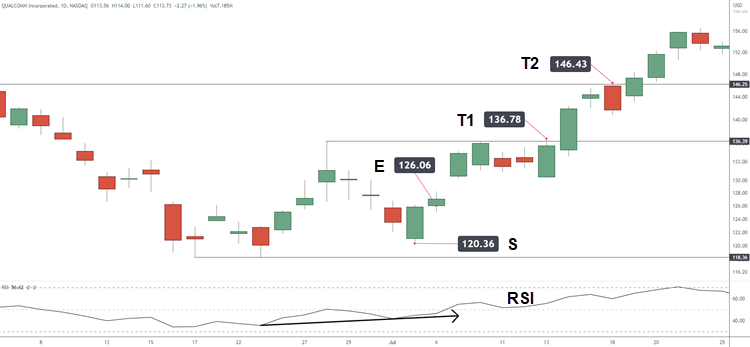
Here is a full example using the strategy talked about at the beginning of the article with a daily stock chart. I have added a trading indicator, the RSI, to monitor for divergence.
Price is leaving a support zone with a higher low and a rising RSI so there is no bearish divergence.
Our bullish piercing line forms and the entry price (E) is $126.06. Stop loss goes below the piercing candlestick at $120.36.
There are two price structure targets, resistance, that traders can use for profit targets.
Traders can use a number of techniques including trailing stops to manage these trades.
Tips To Improve the Bullish Piercing Line Pattern
It’s important to understand that a single bullish piercing line pattern on its own does not provide enough information for a trade entry. You should incorporate additional approaches like trend lines, support and resistance levels, or other technical indicators to confirm the reversal signal. The chart above showed other variables to consider.
Another way to enhance your analysis is through sentiment analysis. This involves looking at the overall market sentiment towards a particular asset and how it may influence price movements. For example, if there’s strong positive sentiment towards an asset and a bullish piercing line pattern forms, this is seen as a more powerful signal of an impending price increase.
By combining multiple analytical tools like these with the bullish piercing line pattern, you are making a data driven decision instead of emotional trade choices.
4 Tips for Trading the Bullish Piercing Line Pattern
| TIP | Details |
|---|---|
| Confirm the signal with other technical indicators | While the bullish piercing line is a strong signal on its own, it’s always best to confirm it with other technical indicators such as moving averages or trend lines. This will give you greater confidence in entering trades. |
| Use proper risk management techniques | Risk management is crucial when trading the bullish piercing line or any other pattern. Use stop-loss orders and position sizing to limit potential losses while allowing for maximum profit potential. |
| Look for confluence areas | Confluence areas are zones where multiple technical indicators converge, increasing the likelihood of a successful trade. Look for these areas when trading the bullish piercing line pattern as they provide high-probability opportunities. |
| Be patient | While the bullish piercing line can be a powerful reversal signal, it doesn’t guarantee immediate success. Be patient in waiting for confirmation from other indicators before entering trades and avoid rushing into positions based solely on this pattern alone. |
Bullish Piercing Line vs. Bullish Engulfing: Key Differences and Similarities
While both patterns suggest a potential bullish trend reversal, they differ in their level of significance and reliability.
The Bullish Piercing Line pattern occurs when a long red candle is followed by a green candle that opens below the previous day’s low but closes above its midpoint. This suggests that buyers have taken control after a period of selling pressure.

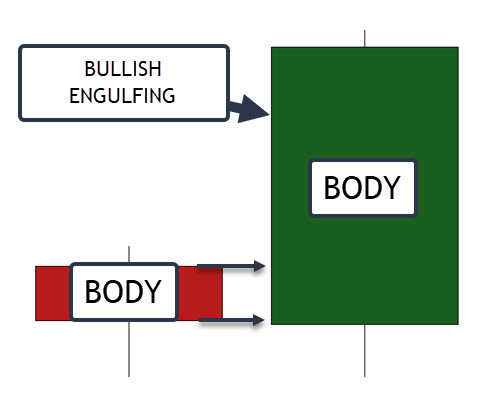
The Bullish Engulfing pattern starts as a piercing but then closes above the entire candlestick. This suggests a stronger shift towards buying pressure than with the Piercing Line pattern.
Both patterns require confirmation from following price action before traders can be confident in their signal.
Frequently Asked Questions
What level of accuracy does the piercing line candlestick exhibit?
The accuracy of the piercing line candlestick varies depending on market conditions and confirmation signals.
What is the distinction between bullish piercing and bullish engulfing?
Bullish piercing and bullish engulfing differ in their formation and interpretation. Bullish piercing occurs when a downtrend is interrupted by a bullish candle that closes above the midpoint of the previous candle, while bullish engulfing engulfs the entire previous candle.
What are the trading strategies associated with piercing candlesticks?
Trading piercing candlesticks involves looking for confirmation signals, such as bullish price action or trend reversals, and considering risk management techniques.
What’s the difference between piercing line and dark cloud cover candlestick patterns?
The difference between piercing line and dark cloud cover lies in their formations and interpretations. Piercing line occurs when a downtrend is interrupted by a bullish candle that closes above the midpoint of the previous candle, while dark cloud cover occurs when an uptrend is interrupted by a bearish candle that closes below the midpoint of the previous candle.
Conclusion
By following the tips and techniques outlined in this article, you can effectively identify and trade this pattern in the forex market.
Remember that while this pattern may not always guarantee a successful trade, it will help inform your decision-making process.
Now that you understand the significance of the Bullish Piercing Line Pattern and how it differs from other patterns such as the Bullish Engulfing, you’re armed with valuable knowledge to take on the markets.
As with any trading strategy, it’s important to continuously educate yourself and stay up-to-date on which way the instrument is moving. Trading against the trend can be a painful experience when not done right.

