

- December 23, 2024
- Posted by: Shane Daly
- Categories: Trading Article, Trading Indicators

If you’ve mastered basic stock analysis but aren’t achieving the returns you want, it’s time to boost your trading strategy. While simple moving averages and momentum indicators can point you in the right direction, they won’t reveal the complete market picture you need for more consistent profits. Advanced techniques like the Ichimoku Cloud, multi-indicator confirmation, and chart pattern recognition can improve your trading approach.
TLDR
- Multi-indicator validation combines RSI, MACD, and volume indicators to confirm trends and reduce false signals in stock analysis.
- Ichimoku Cloud analysis provides comprehensive market insights by integrating five components for trend strength and direction identification.
- Chart pattern recognition with three or more data points helps predict price movements through ascending and descending triangle formations.
Ichimoku Cloud Analysis
How can traders make sense of complex market movements? The Ichimoku Cloud offers a comprehensive solution by combining multiple indicators into one powerful tool. You’ll find it easier to spot trends and make trading decisions using this all-in-one approach.
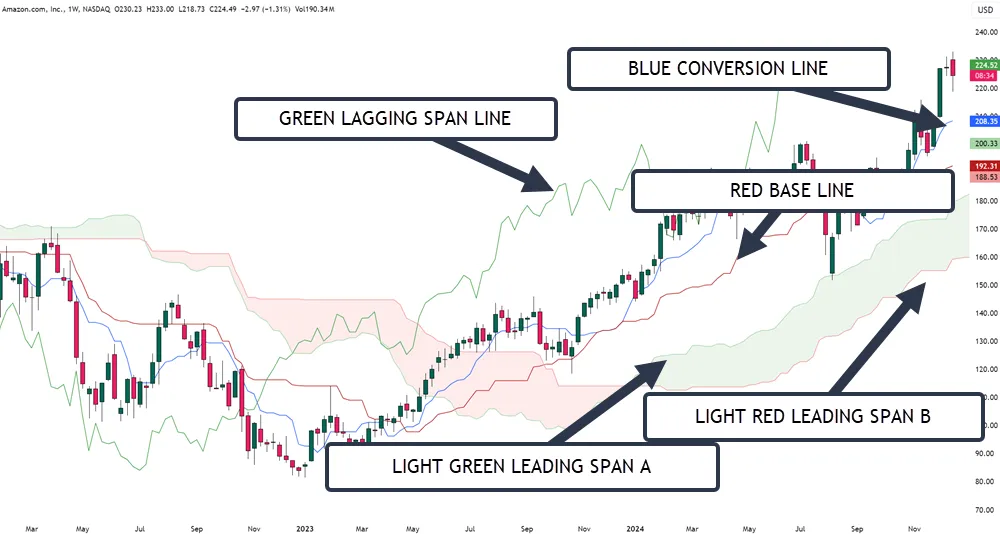
The cloud consists of five key components that work together to generate Ichimoku signals. When you’re looking at the chart, you’ll see two main lines – the Tenkan-Sen (Conversion Line) and Kijun-Sen (Base Line). These lines create buy signals when they cross upward and sell signals when they cross downward. The cloud color indicators help distinguish between bullish green and bearish red market conditions.
Interested in using the Cloud? Learn More Here!
The cloud itself, formed by Senkou Span A and B, helps you gauge trend strength. When prices stay above the cloud, you’re in an uptrend; below it means you’re in a downtrend.
You don’t need to get overwhelmed by all the components. Start by focusing on the basics: watch where the price is relative to the cloud and look for the crossovers.
As you get more comfortable, add the Chikou Span (Lagging Span)to your analysis. It’ll help confirm your trading decisions by showing you how current prices compare to past movements.
For optimal results, combine Ichimoku analysis with statistical arbitrage strategies to identify and capitalize on temporary pricing imbalances in the market.
Multiple Indicator Confirmation
While the Ichimoku Cloud provides valuable observations, relying on a single indicator can sometimes lead to false signals.
That’s why you’ll want to use multiple indicators by combining multiple technical tools to confirm your trading decisions. When you use different indicators together, you’re creating a more comprehensive view of market conditions and filtering out potential signals that may lead to failed trades. Divergence patterns between price action and indicators can provide important clues into potential market reversals.

Here’s how you can effectively combine indicators for better trend validation:
- Pair moving average crossovers with volume indicators to confirm the strength of a potential trend change.
- Use RSI with the MACD to verify overbought or oversold conditions before making trading decisions.
- Combine trendline analysis with oscillators to identify potential breakout or breakdown points.
- Watch for agreement between short-term and long-term moving averages to confirm trend direction.
You’ll see that this multi-indicator approach helps you make better decisions.
When several indicators point to the same conclusion, you can trade with greater confidence. Remember, each indicator has its strengths and weaknesses, but when used together, they complement each other and provide a clearer picture of market trends.
Selecting one indicator from each purpose category helps maintain focus while reducing unnecessary analytical noise.
Chart Pattern Recognition
Successful traders regularly rely on chart pattern recognition as a fundamental skill for predicting market movements. By understanding common patterns like ascending triangles and descending triangles, you’ll find that the trades you take have a better outcome.

These patterns are great indicators of potential price movements and trend continuations. When you’re analyzing charts, you’ll want to focus on key elements like trendlines, support, and resistance levels. Look for at least two to three data points to confirm a pattern’s validity.
For instance, ascending triangles often signal an upward trend continuation, while descending triangles typically indicate continued downward movement. Emotional trading can lead to misidentification of patterns, so maintaining objectivity is vital for accurate analysis. If you have to squint to see a pattern, it’s probably not there.
To improve your pattern recognition skills, you can use technical indicators like moving averages and RSI. These tools will help confirm your pattern analysis and provide additional insight into market conditions.
Remember that patterns can appear differently across various time frames, so it’s important to consider multiple perspectives. You’ll find that combining pattern recognition with other technical indicators, like Bollinger Bands or the Ichimoku Cloud, can improve your ability to spot potential trading opportunities and make better decisions about market entry and exit points.
Inside bar patterns frequently appear on lower time frames but are most reliable when identified on daily charts around support/resistant zones for improved risk-reward ratios.
Your Questions Answered
How Do Weather Patterns and Seasonal Changes Affect Stock Market Trends?
Weather influence on stock markets is more significant than you might think. Temperature, humidity, and precipitation can affect investor mood and trading decisions.
You’ll notice that seasonal trends, like the January Effect and “Sell in May” pattern, create predictable market movements.
You can use these patterns to your advantage, but don’t depend on them by themselves – they’re just one piece of your strategy.
What Role Does Options Flow Analysis Play in Confirming Trend Directions?
Options flow analysis can be great for trend confirmation by tracking large-scale options volume movements.
When you spot unusual activity in calls or puts, it often signals institutional investors’ directional bets. You can use this data to validate your technical analysis – high call volume typically confirms uptrends, while heavy put volume supports downtrends.
Watch for spikes in options volume, as they’re particularly strong confirmation signals.
Can Social Media Sentiment Accurately Predict Stock Trend Reversals?
While social media metrics can help predict trend reversals, you shouldn’t rely on them alone.
Sentiment analysis can spot shifts in market mood before price changes occur, but it’s often noisy and unreliable. You’ll get better results by combining social sentiment with other technical indicators.
Remember that sentiment data quality varies widely, and not all social chatter translates to meaningful market movements.
How Do Geopolitical Events Impact Long-Term Technical Analysis Effectiveness?
Political volatility and economic sanctions can reduce the reliability of your technical analysis over long periods. You’ll notice that major geopolitical events often disrupt established trading patterns and historical price correlations.
While technical indicators remain useful, they’re less effective during periods of sustained international tension as price whips around the price chart.
You’ll need to adjust your analysis methods and combine them with geopolitical monitoring for better trading decisions.
What Is the Correlation Between Trading Volume and Trend Reliability?
Trading volume acts as your key indicator for trend reliability.
When you see high volume accompanying a price movement, it’s more likely to be sustainable. Volume spikes often signal important market shifts, while consistent volume growth provides strong trend confirmation.
You’ll want to be cautious of price movements with low volume, as they’re less reliable and more prone to sudden reversals.