- July 13, 2021
- Posted by: Shane Daly
- Category: Trading Article
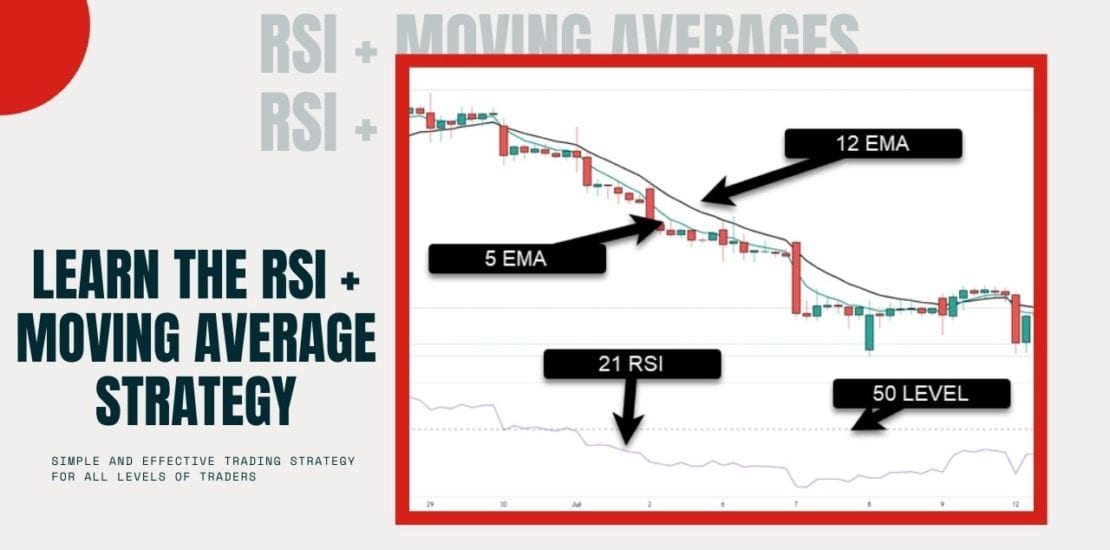
This trading strategy is a simple approach to trading that does not require a lot of subjective trading analysis.
Newer traders looking for some place to start or experienced traders who’ve put on too many variables for a trade, should find this a good starting point for simplicity.
The moving averages are designed to give an objective trend direction while the RSI is designed to show us the balance of buyers and sellers.
We will use the following indicator settings:
- 5 period EMA
- 12 period EMA
- 21 period RSI
As with all indicators, you are welcome to adjust the settings to suit your style of trading:
- Longer periods with the moving averages won’t be as volatile
- A 20/50 setting will not give as many trend direction changes
- RSI, a lower setting such as a 10, will give more crosses of the 50 line which is used in this trading strategy.
The most important part of any trading strategy is your risk management and exits. We will cover that shortly.
Setting Up The RSI Moving Average Strategy
Whatever charting package you are using, find the indicator tab and select EMA (exponential moving average).
You will set the EMA to periods 12 and 5.
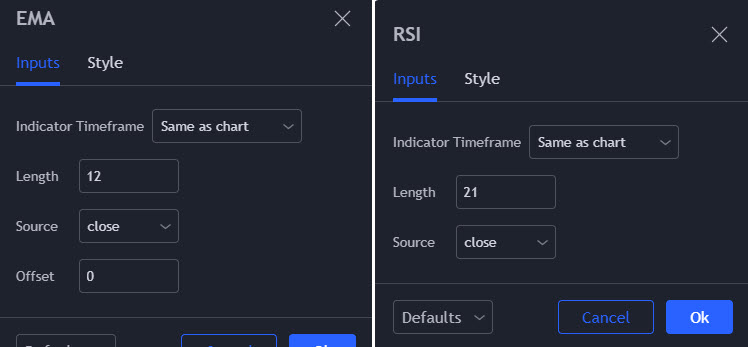 Next, apply the RSI (relative strength index) and use the setting of 21 for the length. This means it will look back 21 periods.
You will also ensure the level line of 50 is on the chart as well.
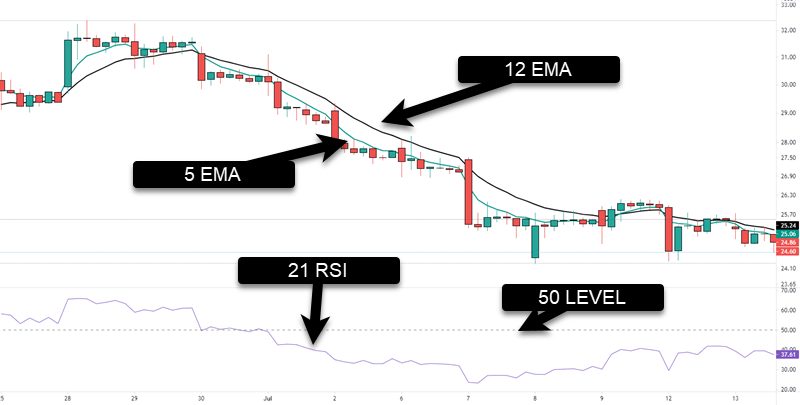
Once complete, your chart should look similar to the one here.
You can see there is minimal clutter which for those traders who trade price action along with an indicator, is something that is important.
What Is A Buy Setup?
The buy setup for the RSI + Moving Average strategy is relatively simple,
- Look for the 5 period EMA to cross over top of the 12 EMA showing us an uptrend
- Look for the 21 period RSI to cross the 50 line indicating the bulls are in charge
- Whatever candle cause the moving average cross or the RSI to cross 50, place a buy stop order above the high
- If more than 3 candles elapse after 1 or 2 occurs but not both, skip the pending setup
This is what it looks like on a chart.
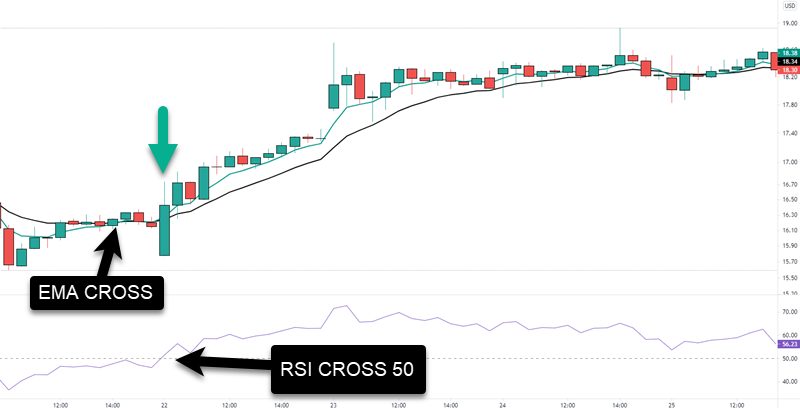
We want to get into a trade when the EMA cross and the RSI crossing 50 occurs. There will be times where one happens and the other one takes a little too long as shown here.
Rule of 3
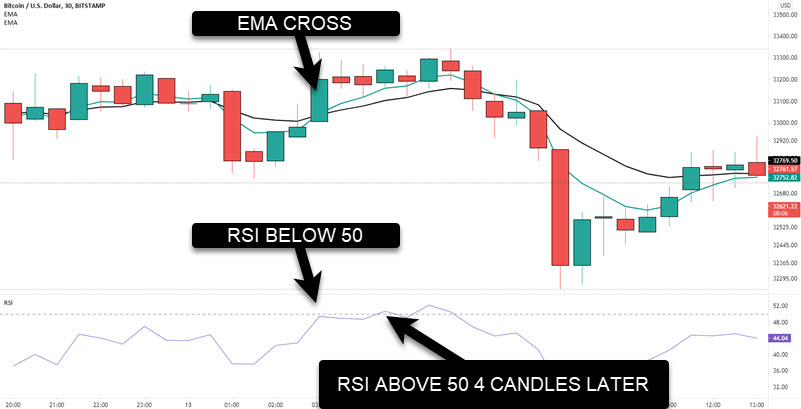
If it takes more than 3 candles for the indicators to be both showing a buy, we want to pass on the trade.
Why?
The cross of the averages is to get us into what is hopefully a sustained trend.
The RSI crossing 50 gets us into a trade when momentum is in our favor.
The failure of the lining up of the indicators within 3 periods (Rule of 3), is a sign that the bulls may not be as strong as we’d like.
Selling Setup
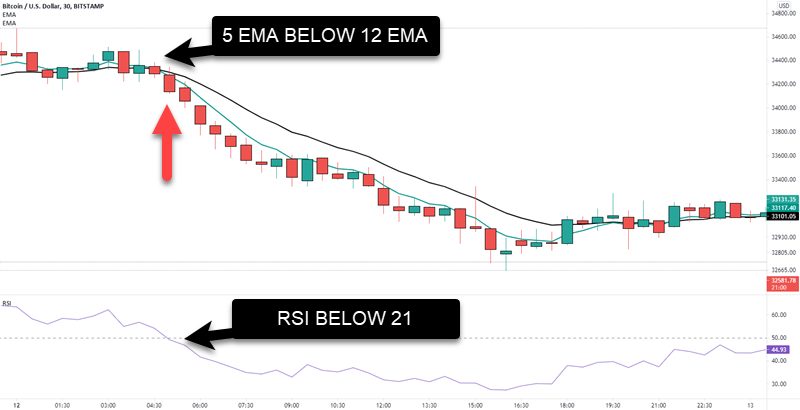
We are looking at the opposite of the buy setup:
- Look for the 5 period EMA to cross under the 12 EMA showing us downtrend
- Look for the 21 period RSI to cross the 50 line to the downside indicating sellers taking over
- Whatever candle cause the moving average cross or the RSI to cross 50, place a sell stop order below the low
- If more than 3 candles elapse after 1 or 2 occurs but not both, skip the pending setup
Here is your sell setup using a chart of Bitcoin.
Where Does Your Stop Loss Go?
There are many different methods to place your stop loss using this strategy.
You could place your stop under the low for a buy or over the high for a short trade.
My favorite method of using stops is the average true range method
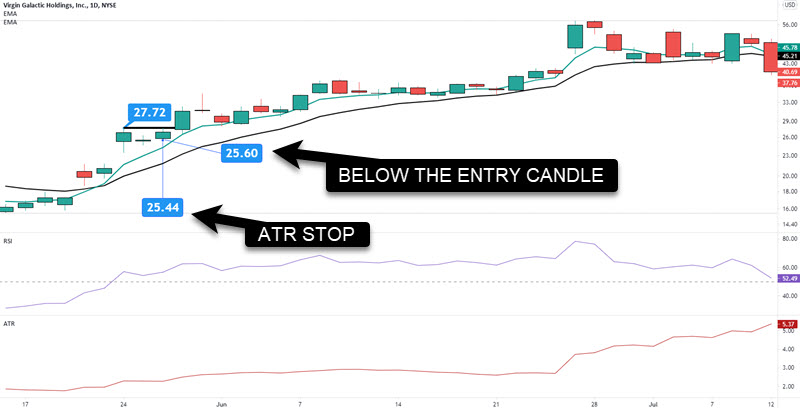
This is a daily stock chart and both the EMAs and the RSI are in our favor at the $27.72 marker. It takes two days for price to break that level.
Using the entry candle as the stop loss location would put your stop at $25.60.
Using the 14 period ATR amount and subtracting from the entry price, will put your stop at $25.44. On the chart, it makes no difference as both stops were never challenged.
The ATR takes into account volatility which is my choice for a proper stop location.
Taking Your Profits
I cover stop location first because protecting your capital is job number one for a trader.
Just like stops, there are different ways to take your profits. What matters is that you are comfortable with it and can execute it consistently.
Some traders will use a multiple of their risk. Using the above example, if you used the ATR stop as your stop loss:
27.72 – 25.44 = $2.28 risk per share
1 X risk would exit at 27.72 + 2.28= $30
2 X risk would exit at 30 + 2.28 = $32.28
You get the picture.
Since we are looking for a trend move, consider using the 12 EMA and the ATR together.
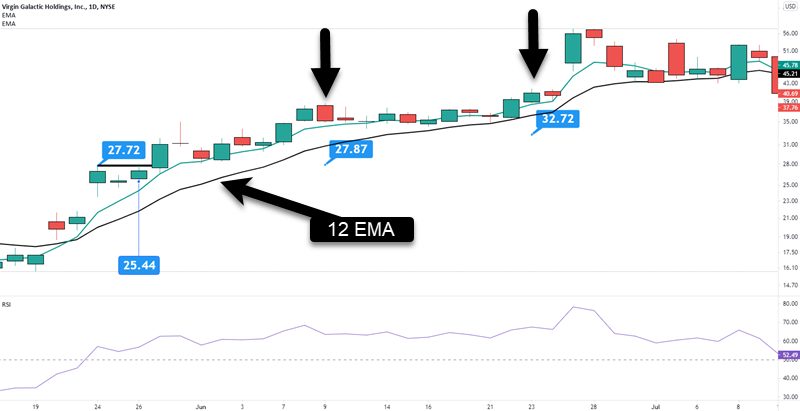
This is the same stock chart as before and as price continues to move up, we’d adjust our stop using the following calculation:
Moving average price – ATR = New stop loss price
The black arrows are where the calculation was done for those two new price points.
This chart eventually stopped out at $41.09 for a $13.37 gain per share.
What About Sideways Markets?
Whenever we use moving averages, whipsaw is a reality as the moving averages snake around each other.
In a trading range, while you will see the moving average snake, you will also get the RSI popping over and below the level 50.
Keep in mind trending structure.
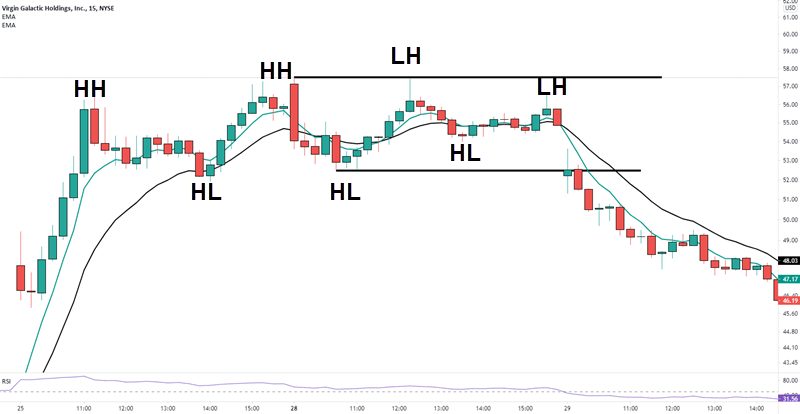
- Uptrend – higher highs and higher lows
- Downtrend – lower highs and lower lows
- Trading range – mixture
My general rule is, for an uptrend, as soon as price fails to make a higher high (makes a higher low), I consider that a trading range could be coming.
The next low, which could be a higher low, puts me on red alert and the next high will make the difference. It must be a higher high for me to discount the trading range.
So will you miss some trades?
Yes.
Maybe.
Consider Price Location
If price is in a potential trading range and is at the upper zone of the range, consider only trades to the downside.
If price is at the bottom, consider only long trades.
The reason for this is that ranges will eventually break. Using this strategy would have you already in a live trade prior to the breakout.
When breakouts happen, they often do with momentum.
You can find yourself in deep profits quickly.
Conclusion
These types of trading strategies can easily be built upon as just discussed with the ranges.
They are not rocket science and can be applied by those looking to day trade or can only check their charts once per day.
Using the trend following trailing stop loss can lead to healthy profits over the long term.
