- March 25, 2021
- Posted by: Shane Daly
- Category: Trading Article
This article is going to cover another trading indicator from the oscillator family known as the Relative Vigor Index (RVI for short).
It is often compared to the Stochastic Oscillator with the major difference being the Relative Vigor Index uses the open and closing values of your instrument. The Stochastics uses the close and low value comparison.
Is that a big difference?
Think about trending price action:
- an uptrend (bullish price action) will have the closing prices higher than the opening price over a set period
- downtrends (bearish price action) will have closes lower than the open over a set period
The RVI is a quick way to judge the direction price is moving.
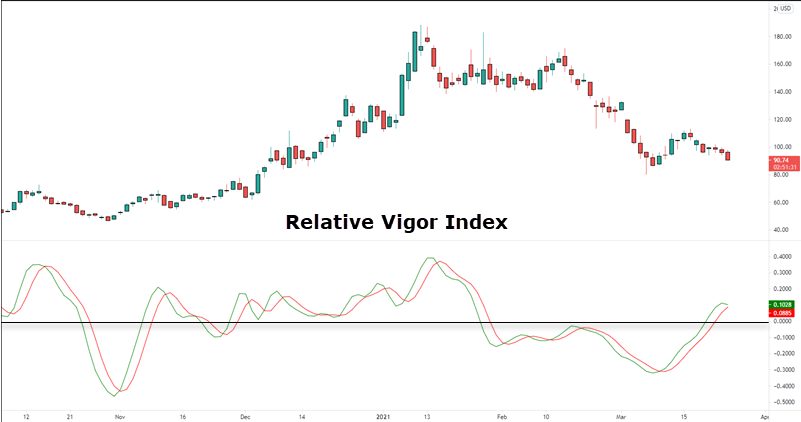
You can see it is a 2 line indicator the oscillates above and below a zero line the way the Coppock Curve indicator does.
The formula to calculate the RVI is not rocket science:
- RVI = (close – open) / (high -low) and it will do so for each period inside of the lookback period of the indicator
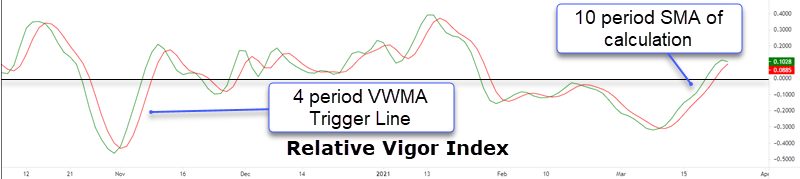
We have two lines, red and green, on the indicator:
- Red line is a 4 period volume weighted moving average (used as a trigger line)
- Green line is a default setting of 10 for the simple moving average calculation of the RVI formula
At first glance, most traders could not tell the difference between this indicator and other oscillators.
They are often used the same way and we will get into specific Relative Vigor Index trading strategies later in this post.
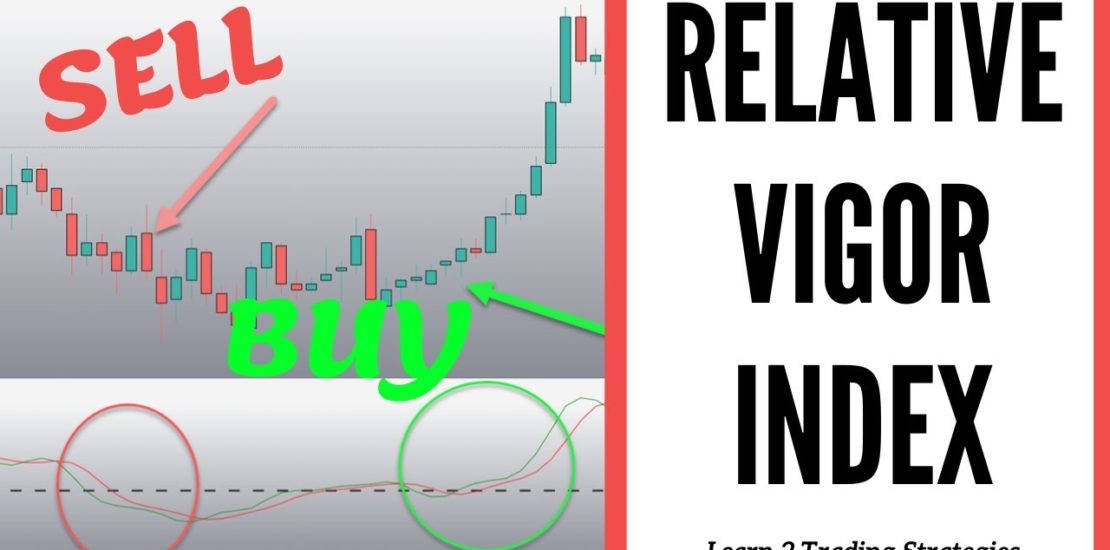
What Types Of Trading Signals Do You Get With RVI?
The most commonly used strategies with two line oscillators are:
- Trading the crossovers of the two lines and/or the zero line – trend determination or buy/sell triggers
- Looking for price divergence where price heads one direction while the indicator heads another direction
I intentionally left out oversold and overbought conditions because the market can stay in those conditions for a long length of time.
You should also know that the indicator may have some issues with ranging markets where we aren’t seeing much sustained price movement in any direction. Due to this, you will want to determine that the instrument you are trading is actually trending.
Those two points are enough for any trader to be able to design some type of trading strategy.
Relative Vigor Trading Strategies
Before we start, what I won’t be doing is adding in another oscillator type of indicator. In any trading strategy, having two indicator from the same family is redundant.
Let’s keep it as simple as we can.
RVI + Bullish And Bearish Divergence
There is nothing new under the sun and using an oscillator for divergence is tried and true.
This is a four hour chart and is an example of a bearish divergence.
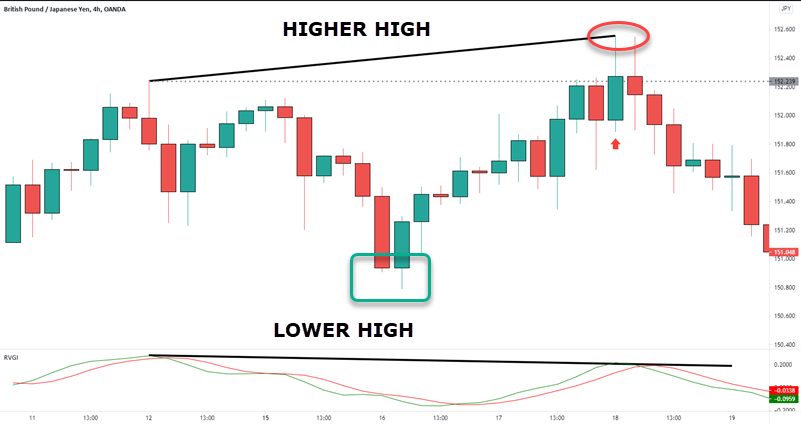
Price puts in a higher high while the Relative Vigor indicator puts in a lower high. Essentially, we are seeing a decrease in momentum of price (remember the calculation) and can position for, conservatively, a short term trade.
Short Trade Rules:
- Find price making higher highs while indicator makes lower high
- Trade entry can be below the candle that breaks the previous peak (small red arrow) OR cross of the green and red line
- Once short, your stop loss will go above the last swing high (red circle)
- First profit target can be at the last swing low (green rectangle)
Not shown but this setup has currently given over a 2% drop in price.
The rules are the opposite for a bullish divergence setup.
RVI + 20 Period Moving Average
This strategy is going to use a trend indicator, the 20 period simple moving average, along with the RVI for two different trade setups.
Price also has to confirm the direction as an added confirmation for trade entry. This means our trade entry will only trigger when price breaks a high or a low.
Buy Or Sell The Zero Line Cross
For this strategy, we want both the red and green line to cross the zero line. We also want price to be on the same side of the moving average and not touching it (confirmed candle). This means if short, price is under the moving average and the RVI lines are below the zero lines and we consider it a bearish trend.
Entry would be a break of the high for buys or low for shorts using the first confirmed candle
Buy Or Sell Line Hooks
For this strategy, considering a buy, we want price above the moving average and the RVI lines above the zero line for a bullish trend.
A buy stop order would be placed above the candle where the lines crossed each other.
Let’s look at a chart of Gold futures – 5 minute price chart.
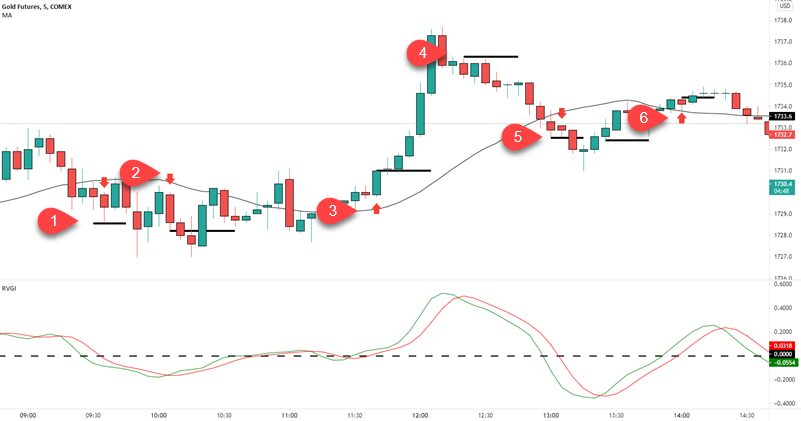
I have not factored in time of day as this is an example only. Some traders will not trade overnight sessions while other traders will only trade the morning.
- Zero line cross – Price not touching the average. Buy stop below the first candle that closes when both red and green lines are negative
- Line hook – The Relative Vigor Index has crossed to the upside and buy stop below the candle where the hook closed
- Zero line cross – RVI has crossed zero and price is not touching moving average. Buy stop the high.
- Line hook – The lines have crossed and buy stop order place that did not trigger
- Zero line cross – RVI has crossed zero and price is not touching moving average. Sell the low
- Zero line cross – The low is not touching the moving average. Buy stop the high
Stop loss can go above or below the candle that triggers the trade.
Profit targets can be previous lows or highs.
I picked a day old chart for this example. Even in sloppy conditions as seen on the left, this strategy did pretty well.
Strategy Adjustments
When using the “Line hook” strategy on a buy setup for example, you may choose to move your entry levels down with each lower high candle. That is a fairly aggressive entry strategy so ensure that if triggered, you don’t let price move too far against you.
While taking trades using the crossing of the lines may look enticing, you may find too many false signals that will cause quite a few losses.
If using the RVI during a price range, I would consider using the divergence trading strategy depending on how tight the trading range is.
Conclusion
- The RVI indicator is versatile and can be used much in the same way as any other oscillator
- It uses 2 lines, red and green, and a zero line that determines a bullish or bearish trend
- You can pair it with another indicator but ensure you aren’t getting redundant information
- Any market, any time frame
Ensure you have a solid understanding of the strategy you plan to use. Test it on numerous charts and the time frames you plan on trading.