- August 26, 2020
- Posted by: Shane Daly
- Category: Trading Article
Traders who follow the trend may want to look at the Vortex Indicator (VI) to not only determine trend direction, but also point to trend reversals and buy/sell signals.
Invented by a pair of Swiss market traders, the Vortex Indicator is simple to understand but is also powerful in it’s simplicity as it measures the market trend, read the review here to learn what companies have been providing investment research for decades.
Let’s discuss:
- What the Vortex Indicator is
- How to read the indicator
- Calculation of the VI
- How to use it with a trading strategy
What Is The Vortex Indicator
The Vortex indicator sits in a separate indicator window from price. You will see two lines that will oscillate over each other:
- One line represents positive trend movement (uptrend in price)
- One line represents negative trend movement (price direction moving down)
- It does not show a consolidated trading environment. Bull/bear only
The lines do not only represent trend but the crosses of the lines can be used as trading signals to enter a position or exit a trade. It actually looks like the average directional index but is calculated differently.

The green line above the red line (+VI greater than -VI) is an uptrend. Lines that are far apart shows a strong trending market while tight lines show a weak trend. Compare the lines above with the price bars and see what relationships you can find.
How does the Vortex indicator measure trend strength? It does so through the use of the average true range (ATR).
Calculation basics:
- Calculate the difference between the previous high and low = positive trend movement
- Calculate the difference between current low and previous high = negative trend movement
- Vortex indicator than uses the previous X periods (you set but default period is 14) and sums them up
The average true range is then used over X number of periods and the indicator adjusts the +/- trend movement with the volatility reading.
Keep in mind that the larger period settings will generally have a smoother indicator. Short term settings can lead to a choppy reading and whipsaws of the plus and minus lines. This will lead to false signals just like you’d see with any technical indicator including a moving average. The setting you use will depend on your trading style.
Vortex Indicator Trading Strategy
Knowing what you know now about the Vortex indicator, it is pretty simple to define a trading system.
- Vortex indicator can tell you the trend direction
- The indicator gives you a measure of trend strength
- The crossover of the lines can give buy signals and sell signals
Let’s utilize a basic strategy using price action trading and simple trend lines. While you could add any number of popular trading indicators such as MACD, simple does have a place in trading.
Multiple Time Frame Trading
We will use a higher time frame for our trend direction. If the higher time frame is up, we will only take buy signals on the lower time frame. Sell signals on the lower time frame will only be taken when the overall trend on the higher time frame is down.
Lower Time Frame
This will be the time frame where we find our setups and the lines trigger our trading entries. Since the indicator uses closing prices, the current high or current low will be where we place a stop order to enter a trade.
This is not a crossover strategy where the indicator generates all of our trades. The VI is simply a tool and we will use other techniques for setups.
In this example, the financial instrument is has an existing trend which is up on the weekly chart.

Since the weekly chart is an uptrend, we will look on the daily chart for buy signals only. We will ignore any short signal.
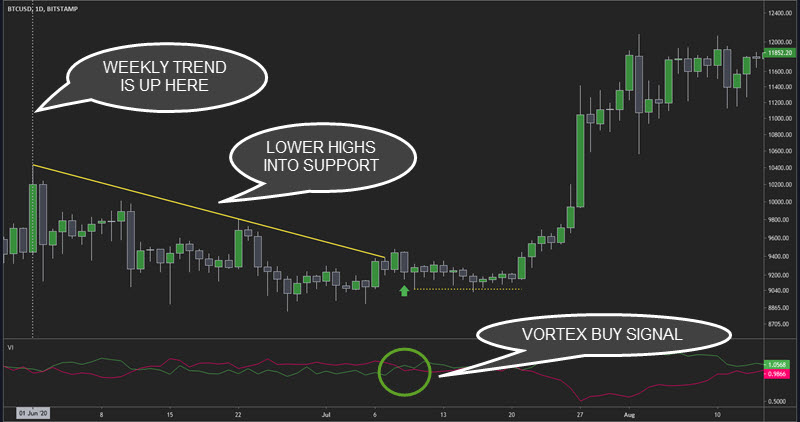
After the weekly chart plots an uptrend, we can see price on the daily chart making lower highs into support.
This is generally a bearish move but we are not considering any shorts.
We see a Vortex buy signal and it is in the context of a break of the down sloping trend line. Using price action analysis, we can see the lower shadows on the candlesticks that make up the support level.
We place a buy stop order over the high of the candle that caused a crossing of the lines for our entry price.
But our breakout of the trend line fails into a trading range and we are not triggered into the trade.
Our trade entry can be:
- At the break of the high where our original entry was set
- Price action traders can read the formation of the trading range and even use a smaller trend line break
- You can wait for the break of the highs and look to enter at any pause
Stop loss locations are vital and there are several places for it:
- Obvious spot is below the larger support area
- You can use the smaller range support level at the dotted line
- Some traders will use a multiple of the ATR to place their stop
You must use position sizing that takes into account risk management that allows for several losses in a row.
What about taking our profits?
Again, there are many ways to trade profits:
- Use the measured move of the height of the bigger consolidation
- Use a trailing stop to ride the trend
- Multiple of ATR trade management
- You could wait for a crossing point of the lines to take profits
If you are using a crossing of the lines for an exit, remember that the parameter length will have an affect on your profits.
- If you adjust the parameters too tight, you can easily get whipsawed out of your position
- Longer periods will keep you in trades longer but can have you riding too much negative price action for your liking
There is no one size fits all approach to trading.
Final Thoughts
The Vortex Indicator does what it is supposed to do: show you the directional movement of price via the oscillating lines.
How you interpret the crossing as a reversal signal is up to you.
I have always preferred adding chart patterns and an understanding of price action into all my trading. Relying on the crossing of an indicator without supporting information can lead to a painful trading career.