- March 17, 2020
- Posted by: Shane Daly
- Categories: Day Trading, Trading Article, trading videos
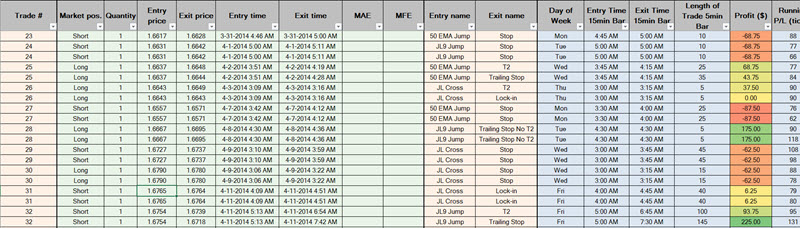
We were doing some work on a trade plan for the British Pound Futures (6B/BP) and decided that it’d be a nice idea to share some of the work I’ve been doing in an Excel Trade Log at the same time.
I prefer using excel for two main reasons:
- it allows greater flexibility
- it’s an excellent learning opportunity.
If you can program with Excel, you are able to customize information that is related to you and your trading strategy.
Learn Not Just Trading Skills
Learning how to use an excel spreadsheet over the past few years has forced me to learn a number of skills. All pretty simple to a seasoned user I’m sure, but when you’re just starting out, it’s not necessarily always so straight forward and it certainly can be daunting.
But really all it takes is a little determination, good use of YouTube videos (I can’t recommend the ExcelIsFun YouTube channel enough) or Google searches and practice – which is why a real life example is such a fantastic opportunity to put your skills to work and find solutions to problems by learning new tricks.
Among the skills that I’ve personally learnt on my Excel journey are:
- macros
- pivot tables
- data analysis pack
- filtering
- named ranges
Not only those but also the many formula available, their nuances and the syntax to make them work. To someone who’s already heavily technical in their work, I’m sure this is a simple task.
But for everyone else, it takes a bit of time and effort in order to get up to speed. However, once you’ve attained a degree of skill, you’ll see just how worthwhile the effort has been.
Track Anything To Measure Trading Performance
So having the skill level to create a decent trading log or for that matter, anything, is clearly going to be helpful in tracking your progress and identifying patterns in results for example.
But what this does is it opens up a whole world of options for you to track every trading day.
If you want to track specific types of trading errors for example to see how much each is costing you, just add a column and once you have enough data, a pivot table will give you what you’re looking for.
If you want to compare your trading results by time of day, it’s simple enough to use either a FLOOR or CEILING formula to group trades in your trading journal so that you can make a useful comparison by 15 mins, 30 mins, 60 mins or by AM/PM for example.
Learn by Example
In knowing how frustrating it can be when you’re try to learn a new skill with little guidance, I want to give you the opportunity to learn by example.
Even when you have a video with someone who’s clearly highly skilled at Excel, if what they’re trying to do is different from your objective, it’s always going to be far more difficult to understand how to incorporate their techniques into the task at hand.
So by having a trading spreadsheet for you to poke and prod, the use of specific formula and other methods used to achieve certain features, I hope will be a little bit easier to get to grips with – and if not, then you can always use the trade log as a trade log template!
Take a look at the spreadsheet in the attached file: Custom Trading Log Sample