- July 10, 2024
- Posted by: Shane Daly
- Categories: Day Trading, Stock Trading, Trading Article

Parabolic stocks are those whose prices increase exponentially, often driven by speculative insanity rather than intrinsic value. As an investor/trader, you should monitor abnormal trading volumes and rapid price accelerations, as these can indicate a shift into a parabolic phase.
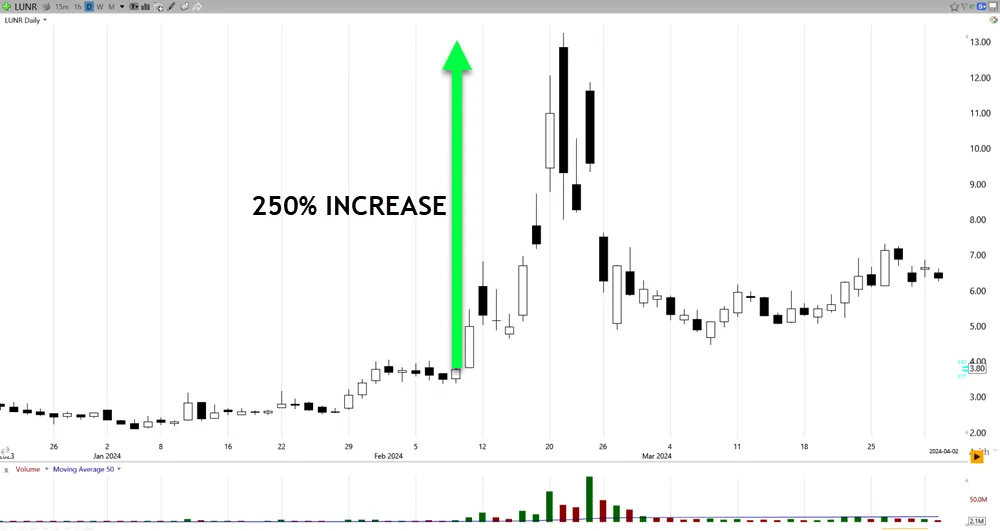
Importantly, these stocks typically detach from their fundamental values due to intense market hype, particularly in small-cap sectors more susceptible to manipulation. If you’re considering trading these stocks, use technical tools like RSI and moving averages for cues. Implement strict risk management strategies, including setting trailing stop losses to protect your investments.
Another losing trade? Try This… FREE BREAKOUT STRATEGY DOWNLOAD
Main Points
- Parabolic stocks experience rapid price increases, often driven by speculative trading and media hype.
- These stocks can quickly detach from their intrinsic values, leading to unsustainable price levels.
- Identifying parabolic movements involves monitoring unusual trading volume and sharp price changes.
- Shorting parabolic stocks requires careful risk management, including setting strict stop-loss orders.
- Trading parabolic reversals entails spotting exhaustion points and using technical signals for timely entry and exit.
Understanding Parabolic Stocks
Parabolic stocks are those that rapidly escalate in value, often exhibiting exponential price increases that form a distinctive curve on a chart. This rise isn’t solely a product of company fundamentals but is significantly influenced by market psychology.
You’ll find that the frenzy around such stocks often stems from speculation, news events, or trader activities, which can detach the stock price from its intrinsic value.

The primary danger lies in the volatility of these stocks. They’re prone to sudden, sharp declines after the peak, which can result in substantial losses if you’re caught on the wrong side of the movement.
Additionally, the small-cap nature of many such companies adds to the unpredictability, as they’re more susceptible to market manipulation and less stable in economic downturns.
Market psychology plays an essential role here, driving prices up far beyond reasonable valuations and creating a bubble-like environment. As a trader, you need to recognize the signs of irrational excitement in price and be prepared for the potential backlash when reality hits and the bubble bursts, bringing prices down to more sustainable levels.
Identifying Parabolic Movements
To identify parabolic movements in stock prices, you should monitor for sharp, exponential increases that suggest a rapid departure from typical market behavior (think, “That’s different”). These movements often resemble a literal parabola on a graph and are usually unsustainable over the long term.
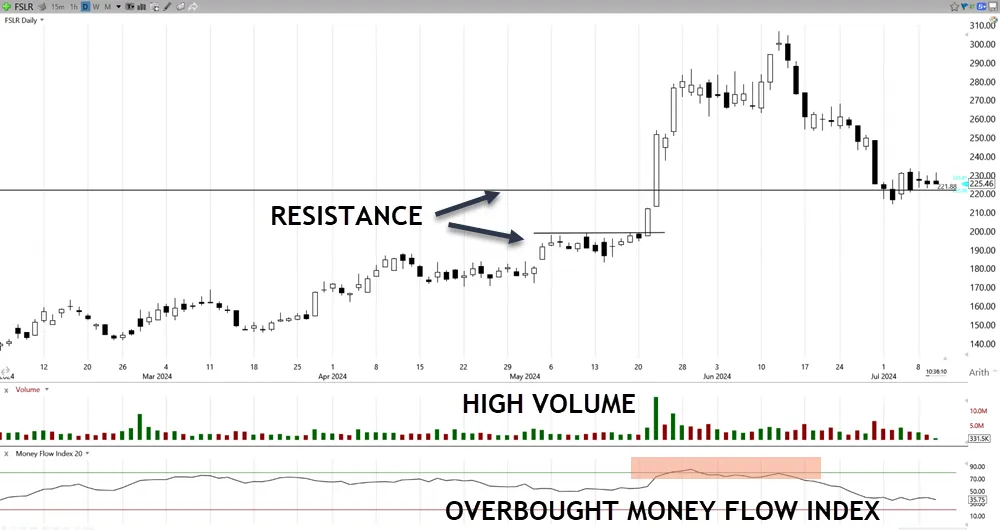
Recognizing these patterns early is essential for risk assessment and can significantly impact decision-making.
Here are key indicators to watch:
- Volume Increase: Look for an abnormal increase in trading volume, which often precedes or accompanies a steep rise.
- Price Acceleration: Notice when the price starts rising faster than usual in a short period, indicating potential speculative activity.
- Resistance Breakthrough: Watch for the stock price to break past previous high resistance levels without clear fundamental reasons.
- Media and News Influence: Pay attention to news or social media hype that might drive interest disproportionately high compared to the company’s actual performance.
Technical analysis tools like moving averages, RSI (Relative Strength Index), and MACD (Moving Average Convergence Variation) can help you identify these movements. Also, consider using other volume indicators such as OBV and MFI. These tools analyze past market data to predict potential price movements, enabling a more informed approach to trading in such volatile conditions.
Shorting Parabolic Stocks
You’ll find that shorting parabolic stocks, which involves betting against securities that have climbed sharply and unsustainably, needs a strategic approach to capitalize on their eventual decline. Your primary focus should be on risk assessment to handle the inherent market inefficiencies that these stocks present.
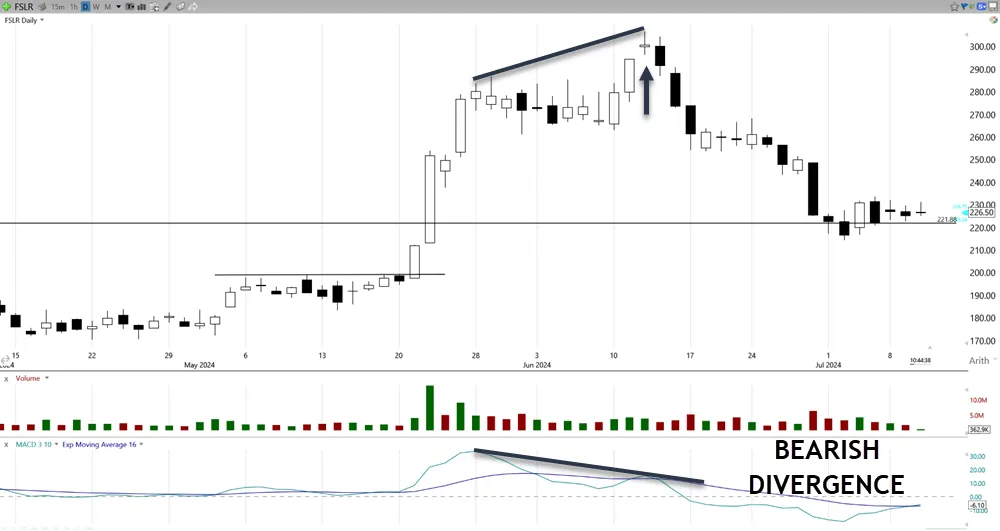
Understanding the stock’s float (the number of shares available for public trading), the frequency of short squeezes, and evaluating how news events or insider actions inflate prices is essential.
Digging deeper into shorting strategies, take a look at the company’s financial health, particularly looking at cash burn rates (the speed at which an unprofitable company consumes its cash reserves) and any signs of shareholder dilution. These factors can indicate whether a stock’s upward movement is likely to fail, providing a safer entry point for your short position.
Managing overnight risks is also important due to the potential for significant price gaps that can occur outside of regular trading hours.
Always be prepared for extreme behaviors from parabolic stocks. This preparation involves setting strict stop-loss orders and having a clear exit strategy to mitigate losses. Anticipating market reactions to exaggerated press releases can also guide your timing and approach to shorting these volatile stocks, helping you exploit the opportunities they present while managing the risks.
Trading Parabolic Reversals
When you trade parabolic reversals, it’s essential to pinpoint precise reversal signals to time your entries and exits so you are entering a time that could lead to profitable trades.
You must develop trading strategies that specify when you’ll enter based on the appearance of exhaustion points and confirm through technical signals on shorter time frames.
Additionally, managing the risks associated with rapid changes in momentum can protect your portfolio from significant losses.
Identifying Reversal Signals
Identifying reversal signals in parabolic stock movements requires observation of exhaustion signs, such as rapid price spikes followed by sudden declines.
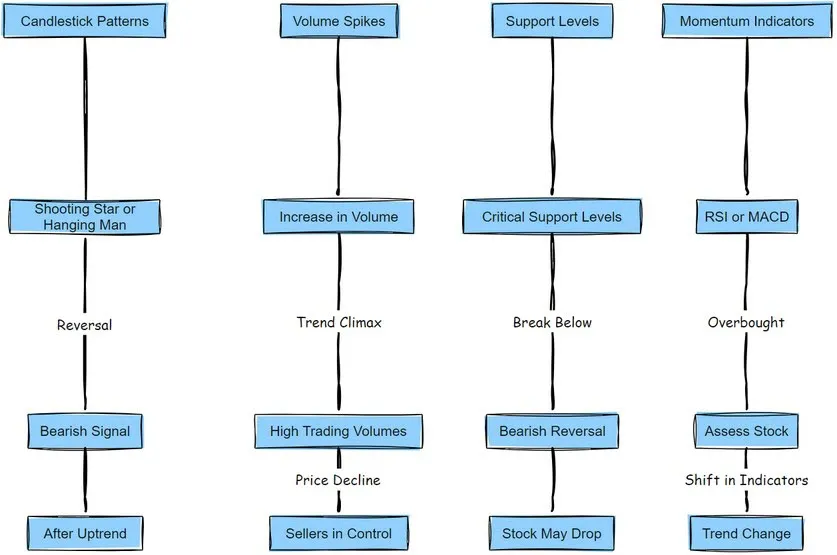
You’ll need to understand various indicators and patterns to pinpoint potential reversals accurately.
- Candlestick Patterns: Watch for bearish patterns like the shooting star or hanging man. These patterns often indicate a potential reversal, especially when they appear after a significant uptrend.
- Volume Spikes: An abrupt increase in volume can suggest that the current trend is reaching its climax. High trading volumes and price declines might signal that sellers are taking control.
- Support Levels: Keep an eye on critical support levels. A break below these can confirm a bearish reversal, indicating that the stock may continue to drop.
- Momentum Indicators: Tools such as the Relative Strength Index (RSI) or Moving Average Convergence Displacement (MACD) can help you assess whether the stock is overbought. A shift in these indicators often precedes a change in trend direction.
Entry and Exit Strategies
Mastering entry and exit strategies are needed for capitalizing on parabolic reversals in stock trading. When considering entry, you should target the first 1-minute low when the potential of a reversal is clear. This will typically offer the best entry point.
This moment captures the initial reversal, maximizing your profit potential while managing risk.
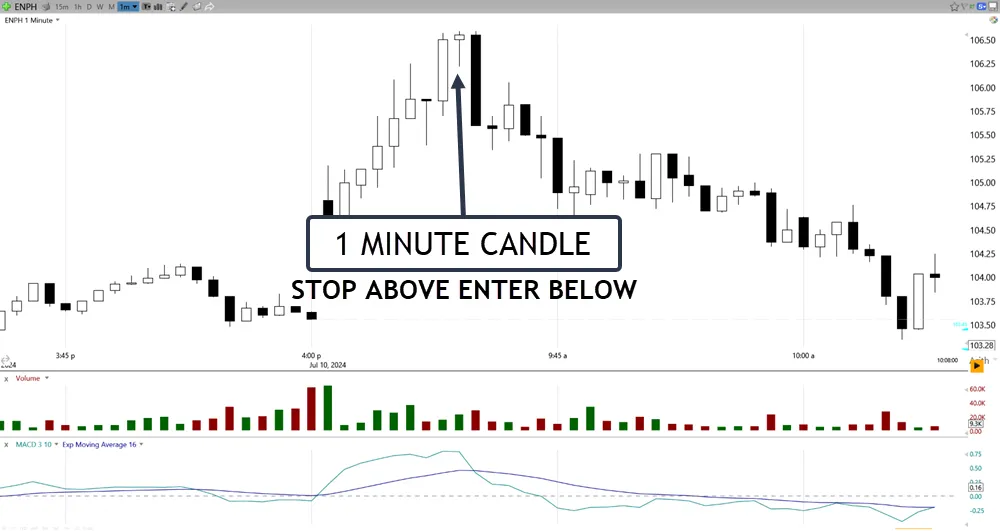
For exit strategies, setting stop losses at the High of the Day or into the body of the first red candle can effectively limit potential losses. To refine these strategies, focus on confirmation signals such as specific candlestick patterns and recognizing exhaustion points. These indicators help ensure that you’re not prematurely entering or exiting based on false signals.
The presence of a clear uptrend or downtrend on 5-minute charts, significant stock extension from the 9ema, and the formation of three large 5-minute candles are good cues as well. These elements signal a robust entry point, increasing the chance of a profitable outcome.
Managing Reversal Risks
Managing the risks associated with trading parabolic reversals requires setting strict entry and exit rules to manage potential losses.
Here’s how you can strengthen your trading approach:
| Strategy | Description |
|---|---|
| Set Clear Rules | Establish and stick to precise entry and exit guidelines. This strategy isn't just about entering at low prices and exiting at peaks; it's about knowing exactly when to get in and out to maximize gains while minimizing risks. |
| Implement Stop Losses | Place stop losses strategically at key levels, such as the High of Day. This not only limits your potential losses but also removes the emotion out of decision-making. |
| Look for Confirmation | Don't rush your entries. Wait for clear confirmation signals and signs of exhaustion in the price movement. Entering too early can lead to significant losses. |
| Practice and Reflect | Use trading simulators to sharpen your skills without financial risk. Keep a detailed journal of your trades to review your success rates and refine your strategy over time. |
Risk Management Strategies
When trading parabolic stocks, it’s necessary to implement tight trailing stop losses to manage risk. This strategy allows you to lock in profits while the stock’s price is on the rise and automatically exits your position if the stock starts to decline, minimizing potential losses.
Understanding the role of position sizing is important when trading. Given the high volatility of parabolic stocks, reducing your position size can be a smart move to limit exposure. Smaller positions mean less risk to your overall portfolio if a trade moves against you.
Position sizing example
- Account Size: $100,000
- Risk per Trade: 1% of the account
- Stock: ABC
- Entry Price: $163.65
- Stop Loss: $155.75
- Trade Risk: $7.90 per share (Entry Price – Stop Loss)
Calculation
- Determine Dollar Risk per Trade:
- Risk per trade = 1% of $100,000 = $1,000
- Calculate Position Size:
- Position size = Dollar risk per trade / Trade risk per share
- Position size = $1,000 / $7.90 ≈ 126 shares
Diversification is a key element in your risk management strategy. By spreading your investments across different assets or sectors, you reduce the risk of a significant loss from a single parabolic stock’s sudden drop.
This approach balances your portfolio, making it less prone to market fluctuations.
Stay updated with market news and events. These can heavily influence parabolic movements. Utilizing technical analysis tools, like moving averages and volume indicators, also helps in making trading decisions (should be in your trading plan), improving your ability to manage risks effectively.
Each tool provides clues into market trends and potential reversals, essential when you are dealing with parabolic stocks.
Frequently Asked Questions
How Do Parabolic Stocks Affect Overall Market Volatility?
When you trade stocks with extreme fluctuations, it impacts market volatility through increased speculation and shifts in investor psychology, often leading to market manipulation and diverting attention from more stable investment opportunities.
Can Trading Bots Effectively Identify Parabolic Stock Movements?
Yes, trading bots can effectively identify rapid stock movements through algorithmic analysis, incorporating trading strategies that adapt to market psychology and improve risk management, thereby providing precise, real-time trading decisions.
What Role Do Social Media Platforms Play in Creating Parabolic Movements?
You’ve noticed that social media platforms increase market manipulation through influencer impact and algorithms, significantly shaping online communities’ buying behaviors. These mechanisms can heavily influence stock movements by spreading hype and coordinating actions. (AMC, GME)
How Do Regulatory Bodies Monitor and React to Parabolic Stock Trends?
Regulatory bodies monitor and react to rapid stock fluctuations by investigating market manipulation, enhancing investor protection, and ensuring market stability. Their actions include trading halts and collaborations for stringent regulatory oversight. A market-wide trading halt is triggered when the S&P 500 index experiences cumulative declines of 7% and 13% from the prior day’s closing level. This trading halt lasts for 15 minutes if these declines occur before 3:25 p.m. ET.
Conclusion
Before adding parabolic stocks to your trading business, make sure you’ve mastered identifying these fast, steep movements. Shorting such stocks can be lucrative but risky, requiring precise timing and sticking to strong risk management protocols..
Practice trading reversals in a controlled environment to refine your skills. Continuously educate yourself, utilizing every resource available to stay ahead in this volatile area of the market.
Understanding the nuances of parabolic stocks is essential for optimizing your trading strategy and protecting your trades and your trading account.
