- April 14, 2021
- Posted by: Shane Daly
- Category: Trading Article
The McGinley Dynamic Indicator (MDI) is a close cousin to the standard moving averages that most traders are familiar with. Unlike moving averages however, from simple moving averages to the EMA, the McGinley Dynamic actually adjusts automatically according to the speed of the market.
It actually helps mitigate the issue with the standard moving average which is the lag when markets are moving quickly.
That lag can be shorter or longer depending on the period setting you choose with the moving average you are using.
The McGinley Dynamic Indicator has often been described as “the most reliable trading indicator you’ve never heard of”.
Whether that is true or not depends on your take about the reliability of indicators to begin with.
Understanding The McGinley Dynamic Indicator
John R. McGinley invented the indicator because he wanted a more responsive indicator than a moving average. Markets tend to not move in a constant rhythm as momentum steps in to drive price and then disappears to force price into a range.
While you can adjust the lookback period on a MA to account for these changes, that brings another issue of whipsaw and price separation using the average.
For example, a 10 period moving average is more volatile than a 50 period moving average. The 10 period is closer to price (often inside price), while the 50 has a wide gap between itself and price.
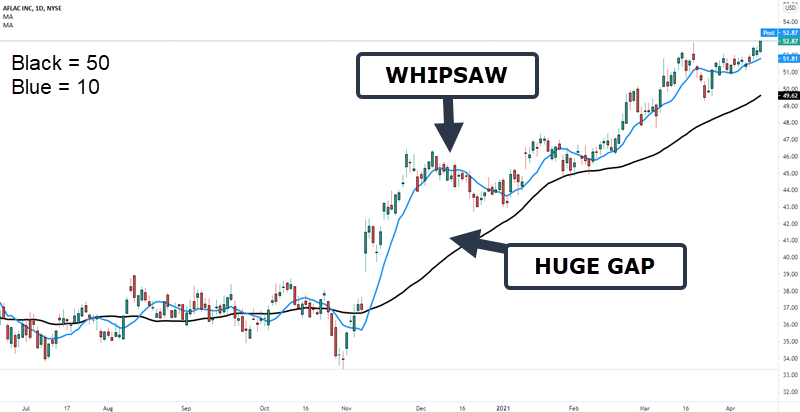
The McGinley Dynamic indicator will take into account shifts in the market speed and shows a smoother and more responsive line. This can cut down on the number of false signals if you are using an indicator for trade entry decisions.
In this example, I have set the blue line to the same setting as the McGinley.
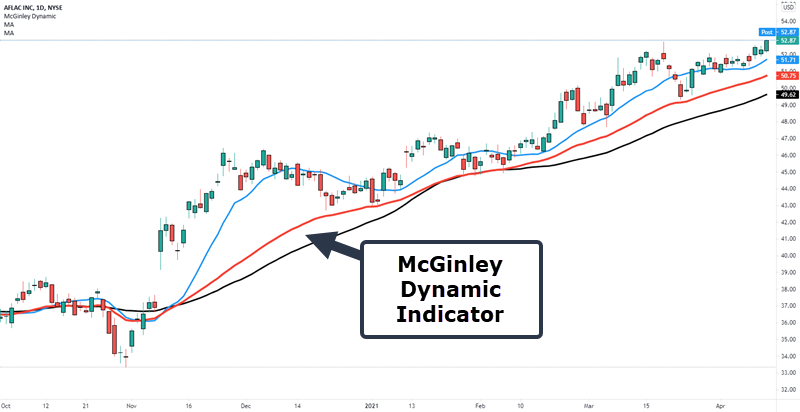
The calculation of the indicator allows it to speed up and close the gap with price. We also see how it slows down and appears to support price while the blue moving average cuts through price.
While the lag has not disappeared, the key point is the indicator is more reactive than the short and long term moving average.
McGinley’s goal was to have the indictor hug price action thereby reducing huge gaps between indicator and price as well as the “snake” effect as an average wraps through price.
How Do You Use The McGinley Dynamic Indicator?
You have learned 3 important things about the indicator:
- Adjusts to changing market speed
- Reduces whipsaw
- Reduces indicator lag
The question becomes how to setup and use the indicator in the market.
It’s a simple as applying to your chart as you would any moving average. You also have to select the lookback period.
The rule of thumb is to use half of what your standard moving average setting would be: 50 period would equal 25 for example.
A common average used is the 20 period so in this example, I set the McGinley to 10.
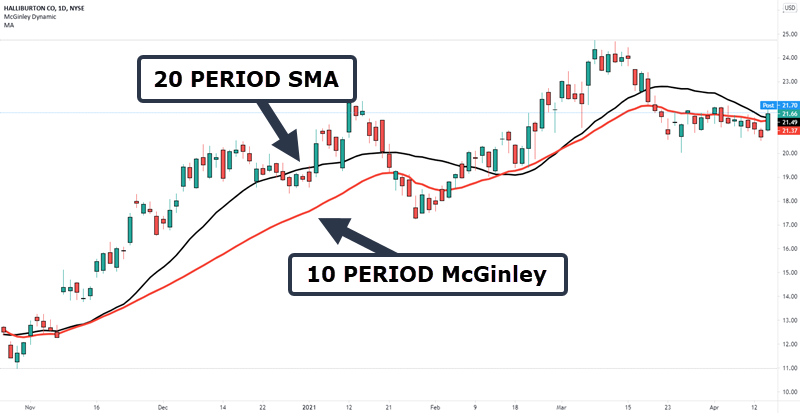
Right away we can see the McGinley is smoother even when using a lower setting. Keep in mind you will adjust the period depending on the type of trader you are.
Swing traders may use a higher setting such as 25 while day traders may use a setting of 5.
Trend Direction/Trend Reversal
A common use of an average is for a quick decision on trend direction.
Looking at an uptrend:
We want to see price move above and stay above the indicator. This will put us in buy mode or look to exit any short positions we may have
Down trending market:
Seeing price break below the indicator and remain there will put us in shorting mode.
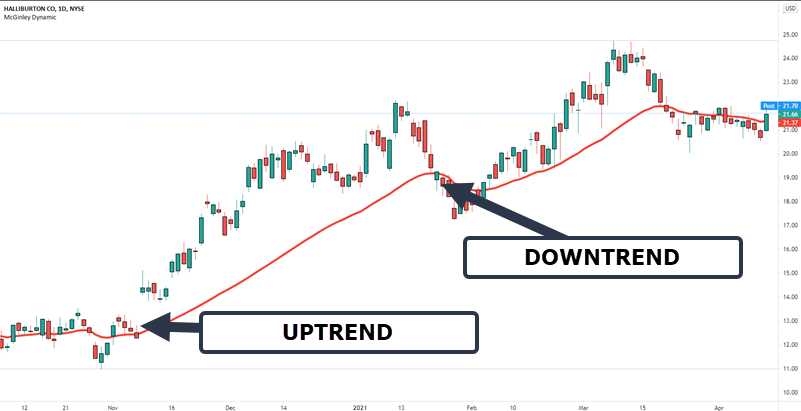
I would also ensure that price is making a higher high for an uptrend or a lower low for a down trend. Using price action along with a trading indicator is, in my opinion, one of the best ways to use an indicator.
I would not use a simple cross of the line as a trading signal.
Which Trading Strategy To Use
You can see it helps determine trend direction but the question should be: “how do you actually trade with it?”
It’s easy to throw on other indicators but I come from the less is more school of trading. Is there a way we can use the McGinley without tossing on MACD, RSI, or exponential moving averages?
Yes.
Use it as a guide.
I published an article about using the daily chart for trading (strategy included) so let’s see if we can improve on it by using the features that come with the McGinley Dynamic.
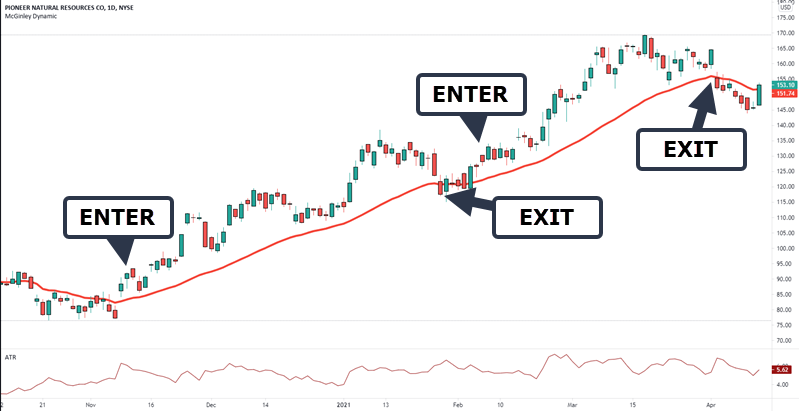
This is a daily stock chart and the setting used is the 10 period MDI.
The trading rules are simple:
- For longs, 2 lows completely above the MDI (For short, 2 highs completely below the MDI)
- Buy stop above the highest of those 2 candles at 20% of 5 period ATR
- Place your stop loss 20% X 5 period ATR below the MDI
- Trail your stop on the MDI line @ 20% ATR from line
Let’s zoom in on just the first trade on this chart so you can understand it a little better.
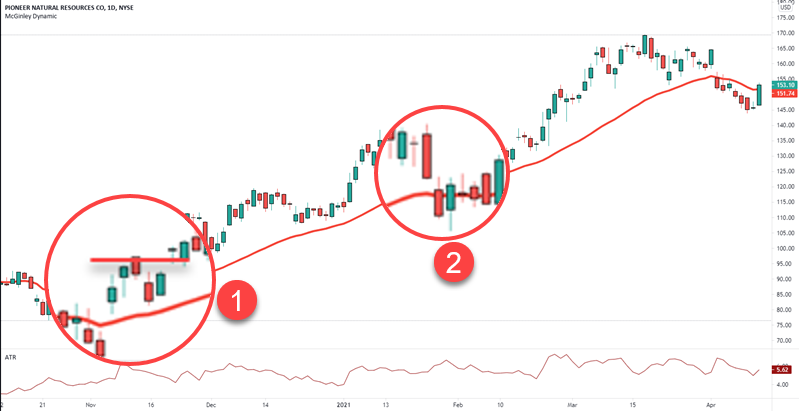
- Two lows are completely above the average and a buy stop is placed above the highest high of those two. Stop is placed 20% X 5 period ATR below the MDI
- Trail your stop on the MDI until stopped out
This recent run was a winner with $29 per share.
Let’s look at another one with some more details.
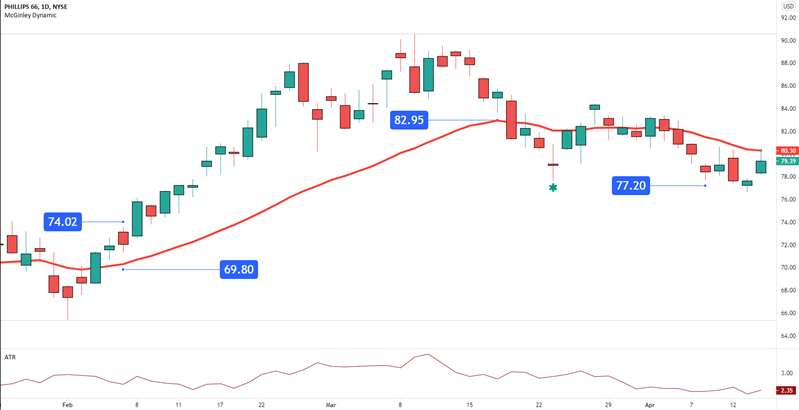
The candles on the left do not meet criteria for a short.
There are not two highs completely below the average.
Our first trade is long at 74.02.
- High of the candle = $73.51
- 20% of 5 period ATR = .51
- Entry price is 73.51+.51 = $74.02
Our stop is set at $69.80.
- 20% of 5 period ATR = .51
- MDI reading = 70.31
- 70.31 – .51 = $69.80 stop loss
A nice first trade win as you trail your stop loss up 20% ATR from MDI.
The green asterisk is a potential short that does not trigger before price closes back above the line.
Finally on the left, this would trade would have triggered in a few days after the setup and you’d still be short.
Should You Use the MDI?
If you are using moving averages in your trading, test this out using the same strategy as you currently use.
I do like the smoothness of it and it does fit nicely in with the trading strategy we just covered.
Should you add another indicator to help with signals? No. I’d experiment with playing pullbacks and reversal from the line before deciding to add another derivative of price to the chart.
Check out our trading article on using bull flags along with the MDI for trend determination.
6 Comments
Comments are closed.

Hello Shane
Thank you for the information regarding MDI.
Does Netpicks sell this indicator for Ninja 8.
I did a quick google search and there were a lot of pages about the indicator, and how to load into different platforms – but nothing about where to purchase it.
Any assistance / guidance would be appreciated.
Kindest Regards,
James Miskiewicz
Hey James. As a Ninjatrader user, did you take a look at this: https://ninjatraderecosystem.com/user-app-share-download/mcginley-dynamic-indicator/
I use TOS platform with TD Ameritrade, and this indicator is not listed. How can I get access to load on my platform?
Take a look at the published code found here: https://usethinkscript.com/threads/mcginley-dynamic-indicator-for-thinkorswim.338/
Thanks Shane – Downloaded and installed.
Thanks again for your help.
Kindest Regrads,
James
Absolutely James. Thanks for reading.