- May 3, 2021
- Posted by: CoachMike
- Categories: Options Trading, Stock Trading, Swing Trading, Trading Article

With markets stuck in this slow grind higher, it has become more difficult to find setups that don’t require chasing price up to new all time highs.
We are seeing so many bad habits formed in newer traders that have never seen a market move to the downside. They just assume markets will head higher non stop going forward. We know this pace is not sustainable on the upside. We will see markets normalize going forward so it is important to stay disciplined with your trading.
Market Moving Catalysts
Last week was full of potential market moving catalysts. We had the Fed statement out on interest rates, which has produced some monster moves in the past. As expected, they didn’t rock the boat and markets finished up near the highs.
We also had a busy earnings week with many of the market moving tech stocks releasing their quarterly numbers. What was interesting was most of these stocks had great earnings numbers but still ended up selling off after the news came out. It was a classic buy the rumor and sell the news event where most of the good news was priced into the stocks as they moved higher the last few months leading up to earnings.
Now that we are past the market moving catalysts for now, how do we stay active in this slow one-way market that is stuck near the highs?
How To Stay Active
The key is to stay as diversified as possible. As options traders, we have the ability to diversify better than most other markets. We can trade a mix of stocks and ETF’s. We can also use a mix of different options strategies to take what the market is giving us instead of forcing just one trade type to work in all conditions.
Let’s take a look at how we analyze stocks on our watch list every day to find new setups. We will use Snap (Symbol: SNAP) as our example to show you how we identify a trade from start to finish using a live trade that is currently setting up for us.
Snap (Symbol: SNAP) – New Bearish Trade
We always start our analysis by looking at the daily chart. While we don’t use this chart for entry and exit points, we do find it helpful in determining whether we are bullish or bearish. It also helps us decide how aggressive we want to be when taking the trade. Do we want to use a long call or put or a vertical spread? The daily chart can help make this an easier decision for us.
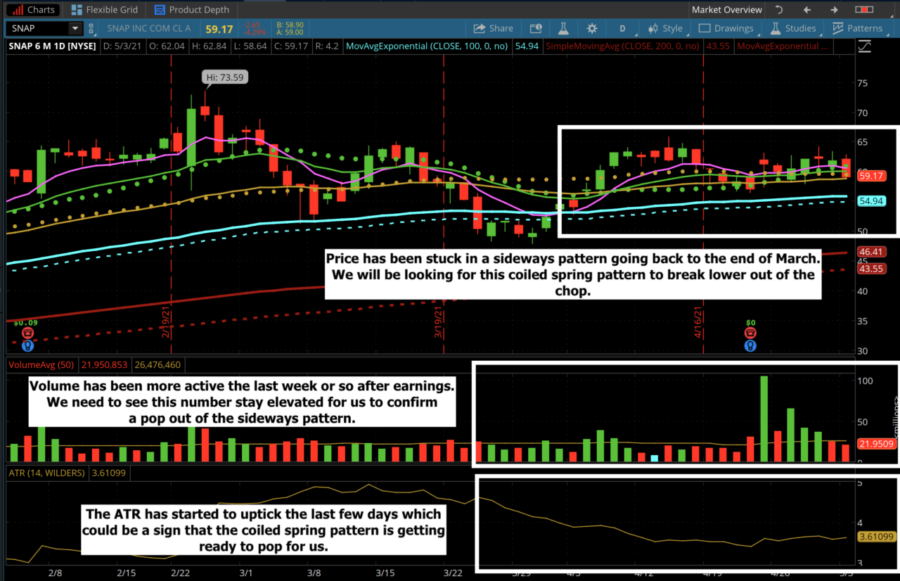
We like to use a handful of moving averages on this daily chart. We will use the 8, 20, 50, and 200 EMA’s as well as the 20, 50, 200 SMA’s as well. These moving averages can be used to identify near term areas of support and resistance and can also help show us if the stock is in a trending move or a choppy sideways pattern.
Moving Averages Used:
- 8, 20, 50, 89, 100, 200 Exponential Moving Averages (EMA’s)
- 20, 50, 200 Simple Moving Averages (SMA’s)
Our daily chart also has a Volume Average indicator at the bottom which gives us a view of how liquid the stock has been of late. The ideal pattern is to see the directional moves back and forth backed up with expanding volume. The bigger volume increases the likelihood of us seeing follow through on the directional moves.
Finally, we like to use the Average True Range (ATR) indicator on the chart to help show how active the stock has been. We like to see the ATR moving in a steady uptrend which indicates good movement intraday. If we see the ATR moving in a downtrend, it can mean price is slowing down and potentially moving into more of a choppy pattern.
Looking at the daily chart of SNAP, we can see price has been stuck in a sideways channel going back to late March. Price has not been able to break out of the channel between $55.50 and $65.00. We call this sideways movement the coiled spring pattern. As price continues to move sideways it is building energy for the next directional move.
Like a spring that coils tighter and tighter, we know at some point the spring will pop. When it does, we will see a nice tradable move. The problem is we don’t know when it is going to pop nor do we know which direction it is going to pop in.
After spending most of April in a lower volume move, along with a declining ATR, we have started to see a slight uptick in both volume and range. This could potentially be early signs of the coiled spring patter popping for us. This has us looking for a more aggressive directional trade on SNAP in the near term.
130 Min and 195 Min Charts
After spending a few minutes looking at the daily chart getting a top level view of SNAP, we then move to the 130 min or 195 min charts. These are our preferred charts to use for entry and exit points. We find both of these do a great job of identifying the best moves without getting caught up in the noise that traders can see on the shorter term time frames like the 15 min or hourly charts. We are going to use the 130 min chart for this SNAP trade.
It is crucial to have a set of criteria that you use to guide entry and exit points. This could be a test of a moving average or a custom indicator that you have found success with. The important part is to have a system in place that will put the odds in your favor long term. This way you aren’t guessing from trade to trade.
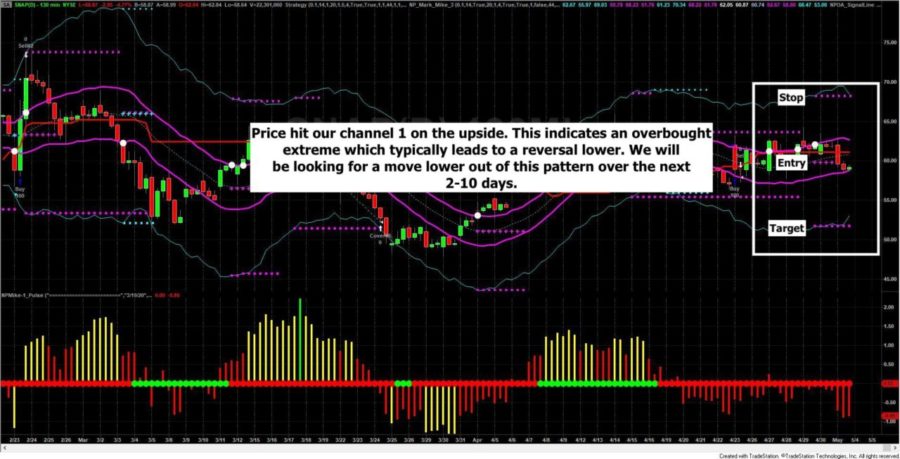
In our case, we like to use a set of custom indicators that we have created on our side to identify our entry and exit points. Looking at the 130 min chart of SNAP, we can see price has tested our channel 1 on the upside. This indicates an overbought condition in the near term. This will often lead to a pullback in the next 3-7 days. 
Please note, we are not concerned with what SNAP is going to do 2 months from now. We are looking for what it will do over the next handful of days. The stock could very well move higher later in the year. However, in the near term we are looking for a pullback to the downside that we can take advantage of.
Our indicators have use getting into the trade as the stock price hits $59.79. Our target level below is when the stock price hits $51.76 with the stop level when the stock price hits $68.22. Our trade is outlined for us from start to finish on the trade. This drastically cuts down on the analysis time to find, take, and manage the trade.
Bearish Trade – Long Put Option
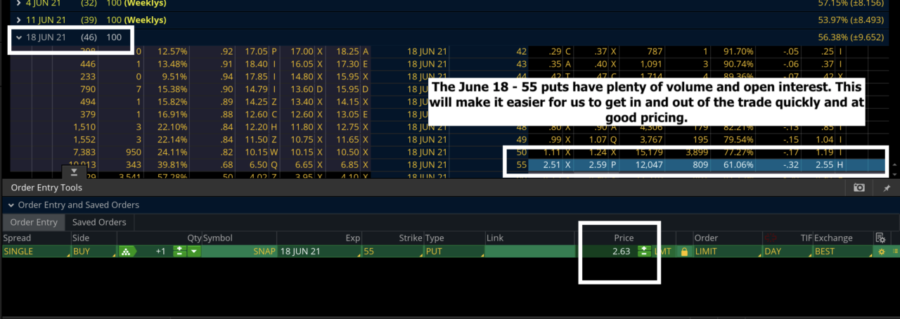
Now that we have determined that we want to lean bearish in the near term, we need to decide how we are going to take the trade with options. For our trades, we are typically looking at options with between 20-60 days left to expiration which has us looking at the June 18 monthly options with 46 days left to expiration.
We are going to use the 55 put options to take this trade with. The 55 puts have good volume and open interest which will make it easier for us to get in and out of the trade quickly and at good prices.
The options can be bought for $2.63 or $263 per contract. This $263 is the most we can lose on the trade if the stock moves against us to the upside.
Our profit potential is unlimited as long as the stock moves lower for us. However, we need the move lower to happen quickly as every day that passes the options lose value from the time decay. This isn’t a deal breaker for us since the options have 46 days left to expiration. We can afford to hold the position for a few days without the time decay crushing the trade. However, the sooner the stock moves lower the better it will be for our P/L.
Risk Management
We will be tracking this position with 2 contracts. Where did we come up with this number? We like to track these trades with our customers with $500 of risk. If you have a bigger account size you can always up the position size. We recommend keeping the risk at 2-5% of your account per trade. This way we have a good profit potential on the trade while limiting the risk on the trades that move against while limiting the damage on the trades that don’t move in our favor.
SNAP Long Put Position
- Stock Entry Price: $59.79
- Stock Target Price: $51.76
- Stock Stop Price: $68.22
- Options Expiration: June 18 monthly options (46 days left to expiration)
- Option Position: 55 puts
- Option Entry Price: $2.63
- Max Risk: $263/contract
- Max Profit: Unlimited
- Position Size: 2 contracts
Conclusion
The key to successful trading long term is to have a defined system in place that guides your entry and exit points. You need to know when to get in and out of trades before putting your hard earned money to work. Using the above approach, will allow you to analyze, place, and manage your trades in just minutes each day.
Is the SNAP trade a guaranteed winner for us? There are no guarantees in trading. However, we know the odds are in our favor. We have a plan in place from the start to maximize our profit and limit the loss at the same time. We are now set up with a plan in place that will simplify our trading and allow us to minimize the amount of time tracking markets throughout the day.
