- July 17, 2023
- Posted by: Shane Daly
- Category: Trading Article
To trade the Dragonfly Doji candlestick, wait for this pattern to appear after a downtrend. Look for confirmation through increased volume or bullish indicators. Consider entering a long position at the opening of the next candle and place a stop-loss below the low of the Dragonfly Doji.
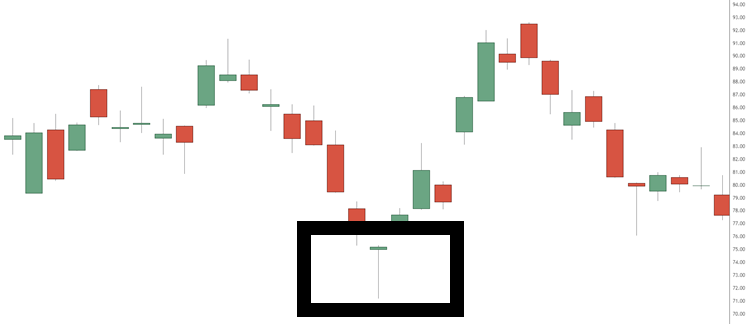 If you’re new to trading, you might be overwhelmed by the sheer number of candlestick patterns out there. But with a little bit of practice, you’ll start to recognize the most common ones, like the Dragonfly Doji. This candlestick pattern is a powerful signal of a bullish reversal, and can be used as part of a complete trading strategy.
What Is The Dragonfly Doji Candlestick?
The Dragonfly Doji is a candlestick pattern that signals potential trend reversals. It is characterized by a long lower shadow, no upper shadow, and a small body near the top of the price range.
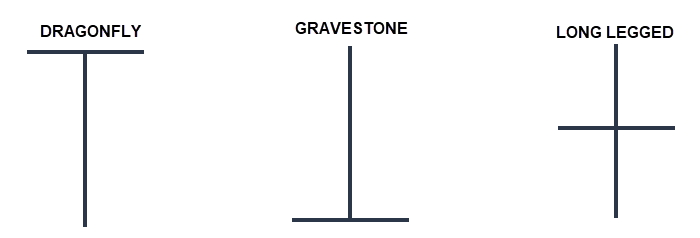 This pattern suggests buyer intervention after a downtrend, indicating a shift from bearish to bullish momentum. Keep in mind these types of candlesticks will not always fit the standard definition of the candle but it’s the concept to be aware of.
Identifying the Dragonfly Doji
To identify a Dragonfly Doji, look for a candlestick with a long lower shadow, little to no upper shadow, and a small body near the top of the price range. The absence of an upper shadow or a very small one confirms buyer strength, as prices were pushed up to the session’s high without encountering resistance. The color of the Dragonfly Doji (green or red) provides further insight into market sentiment.
Interpreting the Dragonfly Doji as a Bullish Reversal Signal
The Dragonfly Doji’s long lower shadow and minimal upper shadow indicate buyers successfully pushed prices back to the opening price despite initial selling pressure.
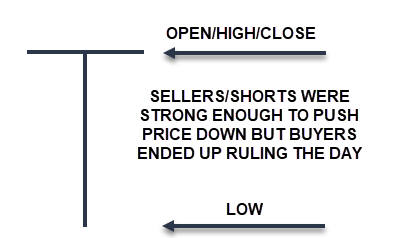 When this pattern appears after a downtrend, it suggests diminishing selling pressure and a potential opportunity for long positions. Confirm the signal with volume analysis and other technical indicators before making trading decisions.
Using the Dragonfly Doji with Other Tools
Combining the Dragonfly Doji with other technical analysis tools can enhance traders’ understanding of market trends and potential trading opportunities. One common approach is to use this conjunction with support and resistance levels.
For example, if this reversal candlestick forms at a key support level, it could signal a potential bullish reversal. Conversely, if it forms at a key resistance level, it could be giving a sign of a bullish continuation move in the instrument.
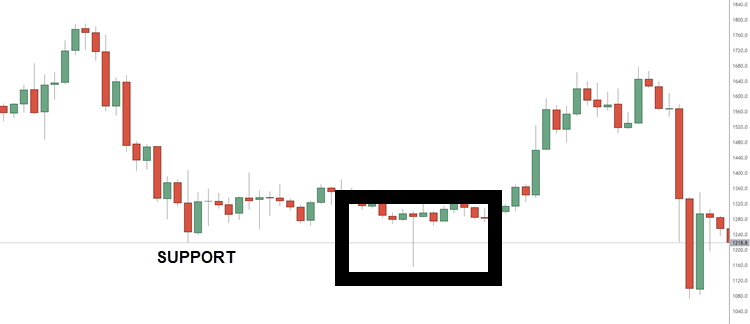 Another way to use the Dragonfly Doji with other tools is to look for confirmation from other candlestick patterns or indicators. For example, if the DD forms along with a bullish engulfing pattern, it could provide stronger evidence for a potential bullish reversal.
Similarly, if it forms along with a bullish divergence on the RSI indicator, it could provide additional confirmation for a potential bullish reversal.
By combining this candlestick with other analysis tools, traders may put the odds in their favor as it’s a sign that bulls are starting to enter the market.
Hammer VS Dragonfly Doji
Both Hammer and Dragonfly Doji are important candlestick patterns that are used to predict potential trend reversals, especially for stocks and forex trading.
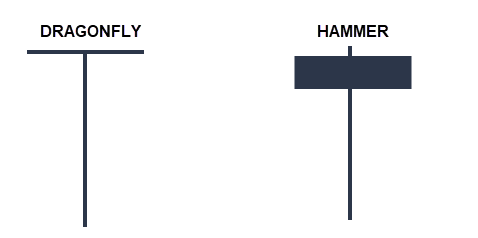 Each pattern is formed by a single candlestick and can provide insights into the behavior of buyers and sellers.
Here is a comparison of the two patterns:
| Formation | Hammer | Dragonfly Doji |
|---|---|---|
| Description | A Hammer pattern occurs after a downtrend. It has a small body at the top, a long lower shadow, and little to no upper shadow. The lower shadow should be at least twice the length of the body. | A Dragonfly Doji also appears after a downtrend. It is characterized by a long lower shadow and no body or a very small body, with the open, high, and close prices being nearly the same. |
| Interpretation | The Hammer pattern indicates that, during the trading period, sellers pushed the price lower, but buyers regained control and pushed the price back up near the opening price. This suggests that buying pressure is increasing, and a trend reversal to the upside might be imminent. | The Dragonfly Doji has a similar interpretation to the Hammer pattern. The long lower shadow indicates that sellers pushed the price down, but buyers managed to drive the price back up to the opening level. This also suggests that buying pressure is increasing, and a trend reversal might be coming. |
| Confirmation | Both patterns require confirmation from subsequent candlesticks to validate the potential trend reversal. Traders usually look for a bullish candlestick with a higher close in the next trading period to confirm the reversal. | Both patterns require confirmation from subsequent candlesticks to validate the potential trend reversal. Traders usually look for a bullish candlestick with a higher close in the next trading period to confirm the reversal. |
In summary, while both the Hammer and Dragonfly Doji patterns signal potential bullish reversals after a downtrend, they differ in their formation. The Hammer has a small body at the top, while the Dragonfly Doji has little to no body. Both patterns indicate an increase in buying pressure and require confirmation from subsequent bullish candlesticks to validate the trend reversal.
Developing a Trading Strategy with the Dragonfly Doji
The first step in developing a strategy with the Dragonfly Doji is to identify it correctly. Once you have done that, you can use it in conjunction with other analysis tools to determine the best entry and exit points for your trades.
One way to use the Dragonfly Doji is to look for it in a downtrend. When you see a Dragonfly Doji form after a series of downward price movements, it could be a sign that the trend is about to reverse. In this case, you may want to consider going long or closing out any short positions you have.
If you see in an uptrend, it may be a signal that the trend is losing momentum. You may want to consider taking profits or tightening your stop loss in this situation. The concern should be that the bears or those exiting positions were able to push price far off the opening print. This could be a sign of weakening bullish action especially after a prolonged uptrend.
By using the Dragonfly Doji in combination with other analysis tools, you can increase your chances of making profitable trades.
Dragonfly Doji Trading Strategy
The Dragonfly Doji trading strategy combines the power of candlestick patterns, trend analysis, momentum indicators, and support/resistance levels to identify potential trend reversals. By observing the daily chart, confirming the presence of the pattern, evaluating trend direction through moving averages, assessing momentum with oscillators, and pinpointing key support/resistance levels, traders can position themselves for successful trades.
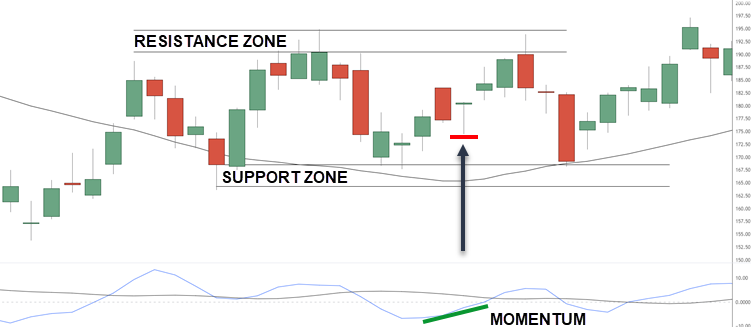 This strategy emphasizes the importance of timing, risk management through stop-loss orders, and setting profit targets while actively managing trades.
| Assess trend direction | Determine the overall trend direction using moving averages. For example, if the 50-day moving average is above the 200-day moving average, consider the trend bullish, and vice versa. |
| Evaluate momentum | Utilize the 3/10 oscillator (or any other momentum indicator) to assess the strength of the reversal signal. Look for bullish divergence or positive momentum confirmation with the Dragonfly Doji pattern. |
| Support/resistance levels | Identify key support and resistance levels on the daily chart. These levels can act as potential areas of price reversal or continuation. |
| Entry point | Once the Dragonfly Doji pattern is confirmed, the trend is in favor, and the oscillator shows positive momentum, enter a long position at the opening of the next candle after the Dragonfly Doji. Ensure that the price is above a significant support level. |
| Set stop-loss | Place a stop-loss order below the nearest support level or the low of the Dragonfly Doji. This helps limit potential losses if the trade doesn’t go as expected. |
| Take profit | Set a profit target by identifying the nearest resistance level or a previous swing high as a potential area to exit the trade. Adjust the target based on your risk-reward ratio. |
| Manage the trade | Monitor the trade’s progress and consider adjusting the stop-loss order to protect profits as the trade moves in your favor. Be aware of any news events that may impact the trade and adjust if needed. |
Frequently Asked Questions
What are common mistakes to avoid when trading with Dragonfly Doji?
One of the main mistakes is to rely solely on this pattern without considering other factors such as volume and price action. Another mistake is to enter a trade too soon without waiting for confirmation from other indicators. Additionally, traders should not ignore the overall market context and should always have a clear exit strategy in place. By avoiding these mistakes, traders can more effectively utilize the dragonfly doji pattern in their trading strategy.
Is the Dragonfly Doji pattern suitable for both short-term and long-term trading?
Yes, the Dragonfly Doji pattern can be used for both short-term and long-term trading. This candlestick pattern is a strong indication of a potential reversal in the market, and can be used to make profitable trades in both the short and long term. However, it is important to remember to avoid common mistakes when trading with this pattern, such as relying solely on the pattern without considering other technical indicators or market conditions.
Are there specific market conditions where the Dragonfly Doji pattern is more effective?
This candlestick pattern can be more effective in certain scenarios, such as when it appears after a downtrend or during a period of consolidation. In these situations, the dragonfly doji can suggest a reversal in the trend or a potential break out. However, no single pattern or indicator can predict market movements with complete accuracy. Therefore, it is important to use the dragonfly doji pattern in conjunction with other technical analysis tools and to practice proper risk management techniques.
How to identify false signals with the Dragonfly Doji pattern?
Look for confirmation from other indicators or patterns. The dragonfly doji should not be relied on as a standalone signal. Additionally, traders should consider the overall market conditions and look for any conflicting signals. It’s important to remain patient and wait for a clear confirmation before making any trading decisions based on the dragonfly doji pattern.
Can the Dragonfly Doji pattern be used with automated trading software or algorithms?
Using the dragonfly doji pattern in conjunction with automated trading software or algorithms is possible. However, it is important to keep in mind that automated trading systems rely on specific parameters and rules to make trading decisions. Therefore, traders must ensure that the algorithm is programmed to recognize and act on the signals provided by the dragonfly doji pattern. Traders should regularly monitor and adjust their algorithms to account for market changes and avoid false signals.
Conclusion
This candlestick pattern is a powerful tool that can be used by traders to identify potential trend reversals in the market. This pattern is characterized by a long lower shadow and no upper shadow, indicating that buyers have stepped in to push the price back up from its lowest point. As a bullish reversal signal, the dragonfly doji can be used on its own or in conjunction with other analysis tools to develop a more comprehensive trading strategy.
To effectively use the dragonfly doji, traders should focus on identifying the pattern on price charts and interpreting its meaning in the context of the current market conditions. By combining this knowledge with technical analysis and other indicators, traders can develop a robust trading strategy that takes advantage of potential trend reversals and market movements.
