- July 29, 2025
- Posted by: Shane Daly
- Categories: Trading Article, Trading Indicators
The Double Bollinger Band strategy can be a powerful tool for identifying market trends and potential trading opportunities. This approach uses two sets of Bollinger Bands to create distinct trading zones, helping you spot strong trends while avoiding choppy markets. By analyzing price movements within these zones, traders can make more better decisions about market direction and ideal entry points.
Video Highlights
- Double Bollinger Bands create distinct trading zones that identify strong trends and choppy market conditions.
- Confirm trade signals by monitoring volume and using additional technical indicators like RSI or MACD.
- Adapt band settings according to market volatility and timeframe, especially in high-volatility environments like cryptocurrency.
- Price movement between outer and inner bands indicates trend strength and potential trading opportunities.
- Focus on price action patterns within zones rather than automatically trading band touches.
Understanding Double Bollinger Band Basics & Trading Zones
While many traders are familiar with traditional Bollinger Bands, the Double Bollinger Band strategy takes this powerful technical tool to the next level. The strategy adds a second set of bands to create 3 trading zones that help you make trading decisions. By adjusting the Bollinger Band settings and using them as market trend indicators, you can better identify potential entry and exit points while avoiding choppy market conditions.

The strategy creates three clear zones on the chart
- When price moves between the outer and inner upper bands, it signals a strong uptrend.
- Movement between the outer and inner lower bands indicates a powerful downtrend.
- The area between the inner bands, known as the chop zone, warns you to stay away from potentially risky trades.
Volume plays a role in confirming trade signals. When price touches a band and shows strong volume, it often indicates a genuine market move rather than a false signal. Traders should also look for divergence in other indicators like RSI or MACD to strengthen their trading decisions. These confirmation factors help reduce the risk of entering trades based on temporary price fluctuations.
One key advantage of this strategy is its adaptability. Different markets and timeframes may require adjusting the traditional 20-period moving average and standard deviation settings. For instance, crypto traders might need wider bands to account for higher volatility, while scalpers could benefit from shorter periods to capture quick moves.
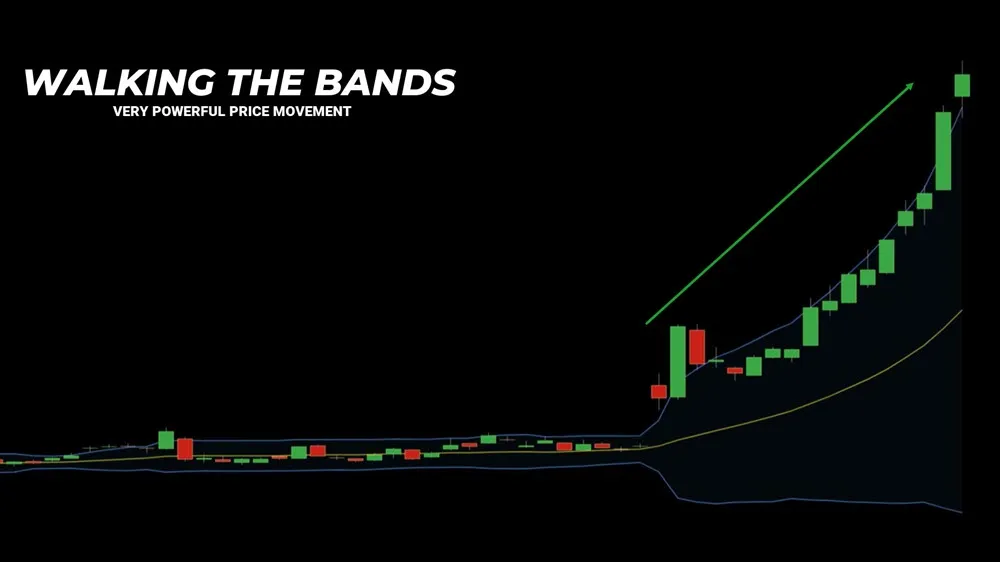
Smart traders know not to automatically buy at lower bands or sell at upper bands. Instead, they watch for price action patterns and consider overall market context. When price “walks the band,” it often signals trend continuation rather than reversal.
The double Bollinger Band setup helps traders stay in profitable trends longer while avoiding the common pitfall of trading against strong market momentum. This systematic approach to market analysis helps traders make more objective decisions based on clear visual signals rather than emotion or guesswork.
Your Questions Answered
How Do Double Bollinger Bands Perform in Ranging Versus Trending Markets?
Double Bollinger Bands do well in trending markets by clearly showing the strength of market trends through price movement between the bands.
During strong trends, prices consistently stay in the outer zones.
However, in ranging markets, prices frequently bounce between bands and stay in the chop zone, making them less reliable as volatility measures.
This helps traders identify when to be active or stay cautious.
What's the Optimal Timeframe for Using Double Bollinger Bands in Day Trading?
For day trading, the 5-minute and 15-minute timeframes work best with double Bollinger Bands, as they provide enough price action without overwhelming trading psychology.
The 5-minute charts suit scalping and quick trades, while 15-minute charts help identify stronger trends.
However, traders should avoid shorter timeframes like 1-minute charts, which generate more noise and false signals, leading to emotional trading decisions.
Can Double Bollinger Bands Be Combined With Other Momentum Indicators Effectively?
Double Bollinger Bands work very well with momentum indicators like RSI, MACD, and Stochastic Oscillator, creating strong indicator collaboration.
When these tools align, they provide solid momentum confirmation for potential trades. For example, if price moves between the upper bands while RSI shows strong momentum, it reinforces the bullish signal.
This combination helps traders identify more reliable trading opportunities and filter out false signals.
How Should Position Sizing Be Adjusted When Trading With Double Bollinger Bands?
Position sizing with double Bollinger bands should align with clear risk management principles.
Traders can increase trade allocation when price moves decisively into trend zones (beyond outer bands) with strong confirmation signals.
During choppy periods between inner bands, reducing position size helps protect capital.
A gradual scaling approach works well – starting with smaller positions and adding as the trend confirms.
What Are the Best Exit Strategies When Using Double Bollinger Bands?
Effective exit strategies with Double Bollinger Bands involve setting stop loss techniques at the opposite band from entry and trailing stops as price moves.
Profit targets can be set at the middle band for conservative exits or at the far band for trending markets.
When price enters the chop zone, traders should consider closing positions to protect gains.
Volume confirmation helps validate exit signals and minimize false moves.
Summary
The Double Bollinger Band strategy give you a reliable framework for identifying trends and market conditions. Through careful analysis of its three trading zones and combined with volume indicators, you can make decision based on actual data. By adapting the strategy to specific markets and maintaining disciplined risk management, you can effectively handle both trending and choppy conditions, leading to more consistent trading results.