- May 4, 2025
- Posted by: Shane Daly
- Category: Trading Article
Measured moves offer you a powerful way to predict price targets using the ABC pattern structure. By analyzing the initial impulse wave (A), corrective pullback (B), and final wave (C), you’ll spot opportunities where wave C mirrors wave A’s distance. While markets rarely form perfect patterns, you can achieve up to 80% accuracy when properly identifying these setups. Understanding market psychology and maintaining strict risk management will help you unlock the pattern’s full potential.
TLDR
- The pattern works across multiple timeframes and markets, requiring clear impulse waves and orderly corrections for validation.
- Measured moves follow a predictable three-wave ABC pattern, where the first and third waves are often equal in distance.
- Price targets can be calculated by measuring wave A’s length and projecting the same distance from wave B’s end.
- Market psychology and trader behavior create self-fulfilling prophecies that help drive measured moves toward their anticipated targets.
- Successful patterns typically show a 30-50% retracement during the corrective phase (wave B) of the total initial move.
What Is A Measured Move In Trading
The measured move is characterized by a three-wave price pattern, where the length of the third wave is nearly equal to that of the first wave. You may have encountered this pattern referred to as the “ABC” pattern or the “A-B=C-D” pattern, both of which accurately describe the price movements you can expect to observe.
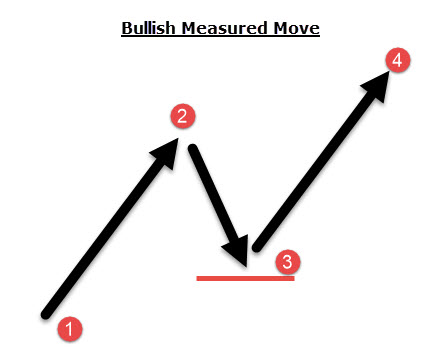
You’ve all seen this price pattern:
- Impulse move to the upside
- Corrective decline
- Price bottoms out and begins to reverse
- The end of the measured move – 1-2=3-4
It’s a simple price pattern that easily resembles a price channel because it will often move in symmetrical sequence.
Why Does The Measured Move Work?
From a psychological standpoint, if the price movement from point 1 to point 2 exhibits strong momentum, traders generally expect a similar magnitude of movement once the price completes its reversal.
Traders who prefer to wait for pullbacks before entering trades typically look for a significant momentum move leading up to the correction. When prices pull back, these traders aim to enter long positions during a bullish rebound.
One thing that a trader will monitor is the depth of the pullback. You can pull out your Fibonacci retracement tools and measure from specific price points or keep it simple by eyeballing the pullback.
- Price pulls back 30-50% of the prior move up, there is some selling interest but not enough to drive price too far
- Deeper pullbacks may show lack of interest to the upside. In those cases, looking at the swing high is a viable approach
There is no need to get all mythic about the measured move. It is just driven by expectations.
How To Use The Measured Move Price Objective
I look at using the measured move pattern in two separate ways:
- Using it for price targets for both bullish and bearish positions
- Looking at the second leg as a resolution of a pullback (think corrective or 2 legged pullback)
We use the 100% of the first leg as a guideline. Price can overshoot or slightly miss that target.
Measured Moves For Profit Targets
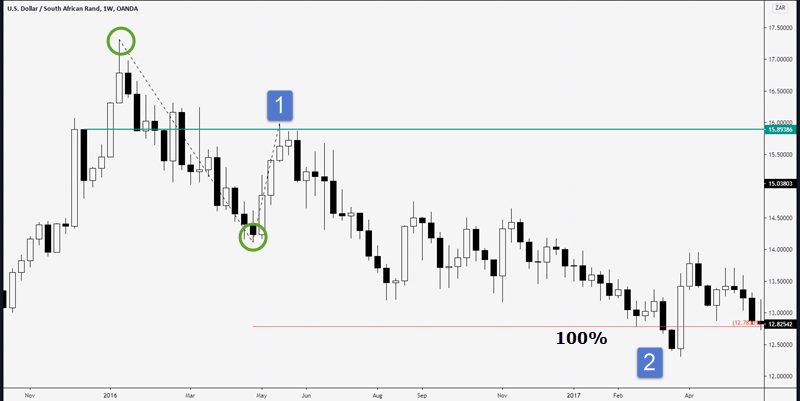
Imagine you have decided to short on a pullback on this chart. Price has moved down as indicated by the two green circles.
Price pulls back into an objective zone of potential resistance and you take a short position at #1.
You measure the distance between the two circles and project that distance from #1 giving you a potential price target.
Price heads down, ranges for weeks, pops at #2 completing the second leg of the move equal to the first.
Let’s see a day trading time frame of a stock chart.
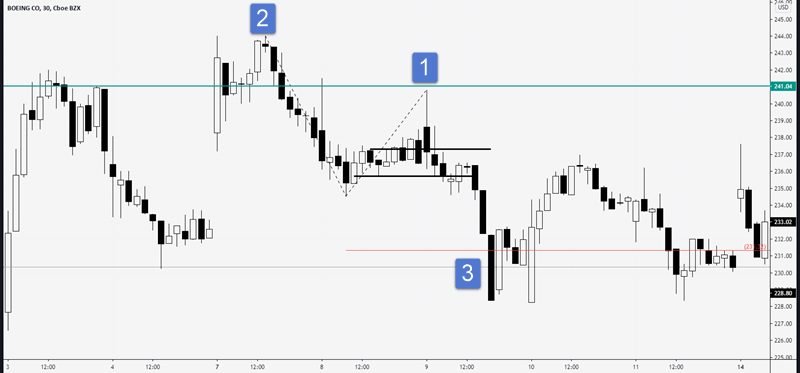
Price gapped up and began to retrace to fill the gap. Price doesn’t put up much fight to get to the upside:
- Price ranged and then poked up to a former area of resistance
- You measure from this location to the pivot low and project from the high at 1 (note the failure test setup at this location)
- Price, with momentum, falls to your measured move price objective 4% lower than the high at 1
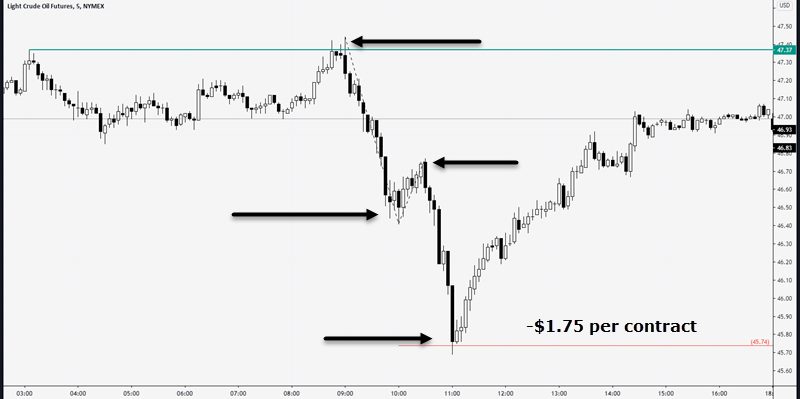
I am going to leave this five minute chart of crude oil from Dec 14, right here. A picture perfect example of our measured move pattern.
Measured Moves With Pullbacks – Continuation Pattern
This is an effective technique that allows you to avoid entering one-legged pullbacks (simple corrections), which often result in being stopped out, only to see the price move in your desired direction afterward.
Looking at the crude oil chart that is in a bullish trend, price is in a trading range and is missing criteria for a breakout trade:
- There is no basing under resistance
- There is no strong rejection of support
- No sequence of higher lows into resistance
Then, we get a break to the downside.
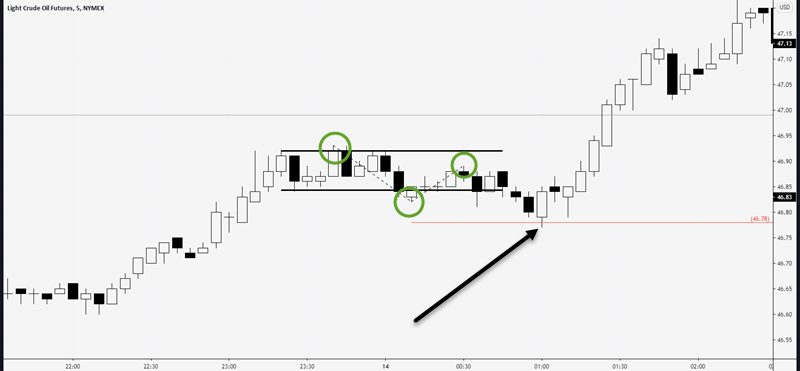
I measured from the first green circle to the bottom green circle and projected that distance from the last green circle. A-B=C-D. Price ticked to the zone and took off to the upside.
Let’s take a look at Natural Gas CFD.
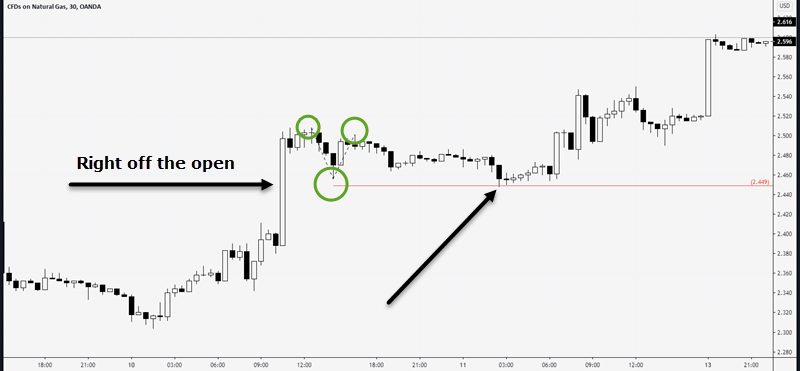
Price opened strong off the open and began to consolidate and making lower highs into support.
We want to go long due to the strong momentum but we need a place to enter. Drawing our measured move gives us an indication of where this consolidation may end. Price drops right to 100% of the A-B distance and begins to bounce.
You can also apply a price channel for a technical analysis confirmation if that is important to you.
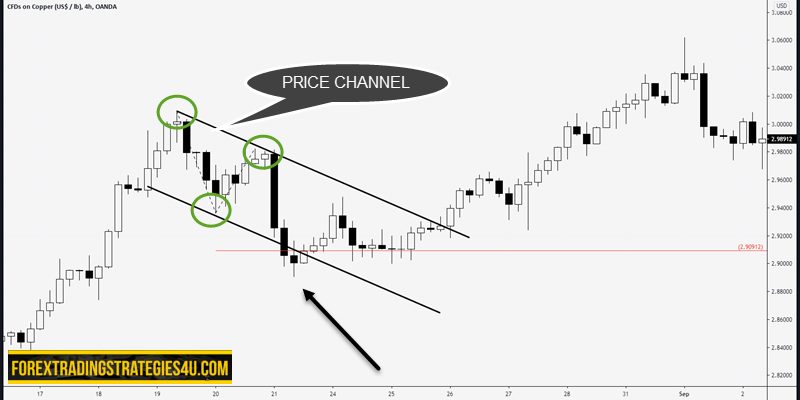
The initial trend is bullish and price begins to retrace. Many traders buy in on the first move up and the price breaks back to the downside. We find price being supported in the area of the measured move and the bottom line of the price channel.
Trading Rules You Can Use
Understanding the Measured Move Technique
What you’ve learned is that the measured move not only provides potential price targets but also helps identify zones where pullbacks may end.
Setting Profit Targets
When placing your entry order, consider setting a profit target price. This approach allows you to adopt a more “set and forget” strategy, reducing the need for constant monitoring.
Identifying Reversal Opportunities
Once the measured move is complete, look for opportunities to enter a reversal trade, especially if the price is near previous swing highs or lows. This can enhance your chances of success.
Trading Pullbacks Effectively
By focusing on trading only after the measured move has completed, you can minimize losses caused by simple corrections. This approach helps you avoid entering trades prematurely.
Importance of Entry Triggers
Ensure that you use an entry trigger rather than simply placing a limit buy order at the measured move projection. This adds an additional layer of confirmation to your trades.
Analyzing Historical Price Levels
Always look to the left at the price projection zone to identify potential support, resistance, or swing levels. This historical context can aid in making more informed trading decisions.
Personal Trading Preference
Trading the measured move is one of my favorite market approaches, and I apply it consistently across every chart I analyze.
Incorporating the Technique
Consider integrating this method into your current trading strategy and observe whether it enhances your overall results.
Your Questions Answered
How Long Does It Typically Take for a Measured Move Pattern to Complete?
You’ll find that measured move pattern completion varies widely, as it’s more about price action than specific time frames.
While some patterns complete within days, others might take weeks or months to fully develop.
I’ve observed that the move duration often depends on market volatility, trading volume, and the timeframe you’re analyzing.
Don’t get fixated on time – focus instead on the pattern completion’s price targets.
Can Measured Moves Be Effectively Used Across Different Market Timeframes?
You’ll find measured moves work effectively across multiple timeframes, from intraday strategies to longer-term swing trading positions. I’ve seen these patterns play out consistently on 5-minute charts and weekly charts alike.
What’s important is that you maintain the same proportional relationships between the moves, regardless of your chosen timeframe.
What Percentage of Measured Move Patterns Reach Their Predicted Target Levels?
While exact success rates vary by market and timeframe, you’ll find that measured moves typically reach their predicted targets 60-70% of the time in trending markets. I’ve observed that target accuracy tends to be higher when the initial leg shows strong momentum and volume.
You’ll get better results by combining measured move analysis with other technical indicators and maintaining realistic expectations about partial target achievements.
Are Measured Moves More Reliable in Trending Markets or Ranging Markets?
You’ll find measured moves are typically more reliable in trending markets, where strong directional momentum supports the pattern’s completion. In my experience analyzing thousands of charts, trending markets offer better trending reliability because they provide clearer price action and momentum.
While you can spot measured moves in ranging markets, their ranging precision tends to be lower due to increased noise and choppier price action.
How Do Earnings Announcements and News Events Affect Measured Move Patterns?
You’ll find that earnings announcements and major news events can significantly disrupt measured move patterns due to sudden price gaps and increased volatility. earnings impact often creates irregular price movements that don’t follow typical measured move ratios.
When you’re trading during news-heavy periods, it’s best to wait for the news volatility to settle before applying measured move analysis.
You might want to avoid taking positions right before scheduled announcements.
Conclusion
You’ve now got the tools to execute measured moves like a seasoned trader. By understanding the ABC pattern‘s psychology, essential components, and real-world applications, you’ll spot profitable opportunities more consistently. Remember to calculate your targets carefully, avoid common pitfalls, and keep practicing these advanced techniques. With patience and discipline, you’ll transform measured moves from complex concepts into your go-to trading strategy.