- April 25, 2025
- Posted by: Shane Daly
- Category: Trading Article

The three black crows pattern appears as three consecutive downward candlesticks, signaling a potential bearish market reversal. This technical indicator shows selling pressure gaining momentum, with each candle opening within the previous candle’s body and closing lower. Traders should exercise caution when spotting this pattern, use strict risk management and confirming the trend with additional indicators. Understanding the pattern’s psychology and context can help develop more effective trading strategies.
TLDR
- Three consecutive bearish candlesticks forming lower lows can signal a strong market reversal and potential downtrend ahead.
- Reliable patterns show minimal wicks, with each candle opening within the previous candle’s body and closing decisively lower.
- Emotional responses to this pattern can trigger panic selling, increasing downward price movement through increased selling pressure.
- Confirm the pattern’s validity using multiple technical indicators and timeframes before making trading decisions.
- Using strict stop-loss orders and position sizing to protect against significant losses if trading the pattern.
Three Black Crows Explained
The 3 Black Crows pattern is a powerful bearish indicator consisting of three consecutive candlesticks showing downward momentum. Understanding its candlestick characteristics is important for proper pattern validation.
While it is described as “black crows”, candles can be any color just as long as the close is lower than the open and the wicks are not too large.

These candles won’t look exactly like this especially in the stock market where you see gaps in price.
Each candle should open within the previous candle’s body and close lower than its open. The pattern becomes more reliable when these black or red candles have minimal wicks and occur during an uptrend.
Does it make a difference? What we are seeing is the opening price higher than the previous days closing price. Will that make a substantial difference in the success of the pattern?
What Does The 3 Black Crows Mean?
This is a strong visual bearish candle pattern that stands out on a chart and they are easy to see.
What they are representing is a strong bearish side to the market. When traders see it in a sustained uptrend, emotions can come into play.
- Traders that are long may look to sell
- Traders may think we are seeing a reversal to a down trend.
Action will be taken.
If you consider the gap in the open price as the original rules suggest, traders will be seeing the bulls getting taken out when they try to go long.
Once price hits lower, the buyers exit their position fueling the move to the downside.
This chart is of ticker MFSL and is currently showing the pattern.
This chart is an an uptrend that is running into all time highs and psychological round numbers. It fulfills all requirements of a bearish candlestick pattern.
If you were long the momentum green candle, what would you be thinking as you see the stock shutting down like this?

Is that enough for you to sell?
That is the point of this article.
Just seeing the pattern should not be enough for any trader to decide to enter a short position. All we are seeing is sustained bearish action over 3 periods (3 hours, 3 days, weeks, months)
How To Trade The 3 Black Crows Pattern
The biggest takeaway will be to not treat it as a bearish reversal pattern without some type of confirmation.
Instead, we will treat it as sign to look for a continuation move back in the direction of the uptrend.
Let’s talk about the confirmation for a bearish move first.
In order to do that, understand what the price action movement of a trend is:
- Uptrend is a series of higher swing highs and lows
- Downtrend is a series of lower swing highs and lows
In an uptrend, price movement would look something like the following:

As long as that trend structure is in place, looking to short is not a wise move.

This stock is in an uptrend, the 3 Crows set up and if you short, you are in a losing trade quickly.
In order for this to be a legitimate contender for a short, you’d want to see, at a minimum, a lower swing high plotting on the chart. You could use a technical indicator for trend but price is my favorite.
The confirmation you’d be looking for is: a price pattern trend direction change where a swing low has been taken out and a lower high.
- Look for the trend structure to change to lower highs and lower lows
- You can use the pattern as a trade setup
If you are seeing a change in trend, then find your entry short using your techniques. Just know that when trends truly change, it doesn’t usually happen with a quick movement. Those holding long will be doing their best to hold the trend.
What is the better way?
Use the 3 Black Crows As A Long Trade Setup
We talked about what makes a true trend reversal.
It’s not just a candlestick pattern.
It’s a change in structure.
The value in the 3 Crows was mentioned in number two above: Use it as a trading setup.
Imagine this is an uptrend in price.

The pullbacks (corrections in price) are where we would look for the pattern as noted with the red arrows.
Once the pattern is found, we would look to find a reversal back in the direction of the trend.
Why does this have merit?
- Remember the emotional aspect of the pattern. Traders seeing the pattern don’t want to miss the short so they sell.
- Those holding long look to exit their position
- Price reverses taking out the shorts and having buyers that exited, buy back in.
- Those who held long add to their position as they see price heading back up
Take a look at this chart.

Price turns from a down trend to an uptrend.
A correction in price takes place putting in the 3 Crows.
A trade entry can be a break of the third crow, a trend line break, or some type of trading indicator entry.
See the black star?
Price was in a structure down trend and after the pattern shows up, you look for the pullback and trade the reversal.
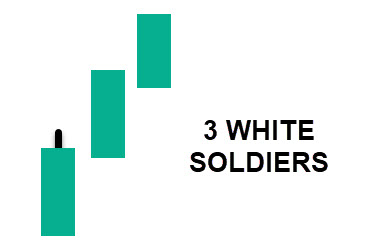
3 White Soldiers
This is the exact opposite of what you just read.

In this case, you’d be looking for these as a pullback in a down trend. While the original and often taught method is a trend reversal, you now know to use price structure.
Psychology Behind Market Reactions
When traders spot the 3 Black Crows pattern, strong emotional responses often follow. Fear and uncertainty can grip the market as participants see three consecutive bearish candles forming in succession. This pattern often triggers a wave of selling as trader emotions shift from optimism to concern.
Market sentiment typically becomes increasingly bearish as each new black crow appears. Experienced traders watch for panic selling, which can create a self-fulfilling prophecy as more participants exit their positions.
However, it’s important that you remember that emotional reactions shouldn’t override careful analysis and proper risk management strategies.
Your Questions Answered
How Long Should Each Black Crow Candle Be Relative to Others?
The three candlesticks should be relatively similar in length, showing consistency in bearish momentum.
While exact lengths don’t need to match perfectly, significantly different candle lengths might indicate weakening pattern reliability.
Each candle’s body should be substantial, with minimal wicks, and the second and third candles should be comparable to the first one’s length to demonstrate sustained selling pressure.
Does the Pattern Work Better in Specific Market Sectors or Indices?
The 3 Black Crows pattern tends to be more reliable in sectors and indices with higher market volatility, such as technology and small-cap stocks.
These markets often experience stronger price swings, making bearish signals more pronounced.
However, the pattern can work in any market that shows clear trending behavior.
The key is focusing on sectors where institutional investors are active, as their trading volume helps validate the pattern’s significance.
What Percentage of 3 Black Crows Patterns Result in Successful Trade Outcomes?
Historical success rates for the 3 black crows pattern aren’t consistently documented across all market conditions.
Like many technical patterns, its effectiveness depends heavily on proper risk management strategies and confirmation signals.
While some traders report success rates between 50-70%, these figures vary widely based on market conditions, timeframes, and individual trading approaches.
Reliable statistical data across different markets remains limited.
Can the Pattern Be Reliable if One Candle Has Significant Wicks?
Significant wicks on the candlesticks can reduce the reliability of the 3 Black Crows pattern. Long wicks suggest price rejection and hesitation, indicating less trend validation.
The most reliable patterns feature minimal wicks and strong bearish candle bodies, showing clear seller control. While a pattern with one significant wick might still be valid, multiple candles with large wicks could signal a weaker bearish momentum.
What’s the Ideal Timeframe to Observe This Pattern: Daily, Weekly, or Hourly?
The 3 Black Crows pattern can appear on any timeframe, but it tends to be more reliable on daily and weekly charts.
Longer timeframes typically carry more weight because they represent larger trading volumes and institutional activity.
In timeframe analysis, daily charts offer a good balance between pattern visibility and trading opportunities, while hourly charts may produce more false signals due to market noise.
Conclusion
The Three Black Crows pattern remains a valuable tool for traders when used with proper caution and context. While no indicator guarantees market outcomes, understanding this pattern’s signals, along with sound risk management practices, can help investors make more informed decisions. By combining pattern recognition with broader market analysis and emotional discipline, traders can better navigate potential market reversals while protecting their investments.
