The momentum indicator (momentum oscillator indicator) is one of the trading indicators available to traders to gauge the momentum in the market.
There are several momentum indicators that can be used for intra-day trading as well as other styles and they include:
- MACD indicator – moving average convergence divergence
- RSI – relative strength index
- Stochastic oscillator – also know as Stoch
You can also use a series of moving averages such as the 3 EMA setup where you’d look for the widening of the space between the averages.
Keep in mind that there is no best momentum indicator. They all measure the same thing except use different means of doing so. You want to use something you understand and that fits your trading approach..
In this article, we are going to discuss the aptly named “momentum indicator” that is in the family of trading indicators known as oscillators.
Let’s discuss why having momentum in the market is an important character we like to see in any security.
Why Is Momentum Important In The Market
Some will say that momentum precedes price which would make it a leading indicator. The fact that the indicators need price to calculate the output, that statement needs clarity.
Momentum indicators measure the amount the price of a security changes over time – the speed at which the price advances or decline.
- A market where the price differential is changing with a larger price jump during the period on the indicator, we would consider increasing momentum
- If the price is changing with smaller jumps, the momentum is declining
If we use the momentum indicator as the example, the calculation is: (Price today / Price n periods ago) x 100
You can see we are simply comparing prices, generally the closing price, and looking for a percentage change in price. Nothing too complicated.
The rule of thumb is:
- If momentum makes a new high, we expect to see a new high made in price – buy the next pullback
- If a new low is made in the momentum indicator, we expect to see lower prices – short the next move up
- If a new price high is made but a lower momentum high (loss of momentum – this is known as bearish divergence), we may see a stronger retrace in price
Traders who play breakouts from ranges may find the momentum oscillator indicator to confirm the breakout. If you are looking at an upside breakout from a range and the momentum indicator makes a new high, you may choose to buy the first pullback after the breakout.
In short, seeing momentum increase in a market is a sign that the current direction will continue after any corrective move. Understanding that will be vital for pullback traders who choose to include a momentum reading for any buy or sell signal.
How To Use The Momentum Indicator
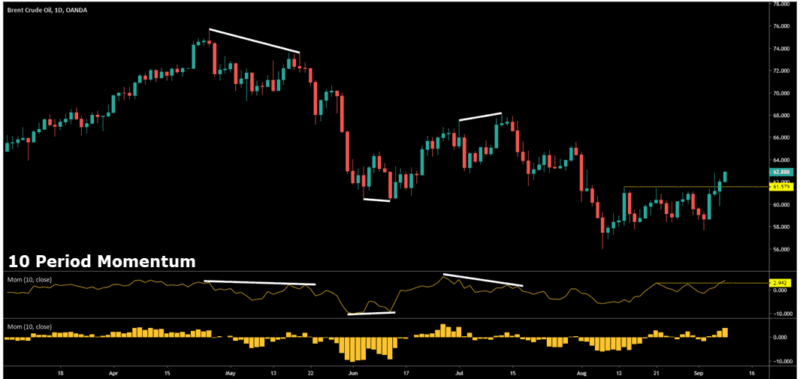
The first thing you need to do is apply the indicator to your charting platform on any time frame you choose. In this graphic, I have added the line version as well as the column version which you can change in the settings on some platforms.
You decide which one calls to your eye the best – there is no best answer!

I have highlighted a few things that a trader would take note of and how to read the indicator:
- Lower highs in price and lower highs in momentum – a sign of continuation
- Lower lows in price but higher lows in momentum – a move higher may be a move you can trade (does NOT automatically mean a trend change)
- Breakout of range and higher high in momentum – greater probability of price moving from breakout location
You should also note that the momentum indicator:
- Does not tell you trend direction. You can use price action or a moving average to determine bullish or bearish markets
- In the simplest form, does not use any momentum indicator crossover
- In unbounded which means you can’t look at the indicator to see an oversold condition or overbought condition
With any trading strategy using this form of technical analysis, you must compare actual price action to the reading on the indicator.
Look at the posted chart in terms of price reaction and the momentum indicator and make notes of what you see. This is the better way of learning and understanding as opposed to it all being explained.
Momentum Indicator Strategy
One of the best uses of the momentum indicator is as a prerequisite for trading pullbacks.
Why?
One thing traders should see when looking to trade a corrective move is the potential for price to continue. The momentum indicator will assist you in locating momentum in the impulse price move which your trading plan should require for pullback trading.

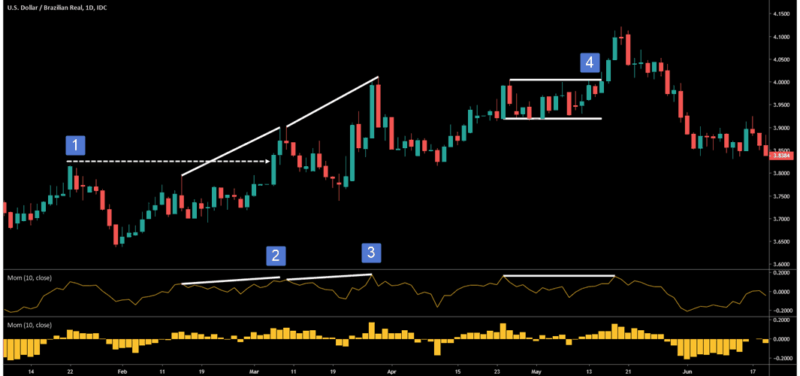
Let’s break down this chart:
- Using the price action definition of an uptrend, price breaks this high, giving us higher highs
- Momentum indicator makes a new high as does price. We trade the pullback for a long trade
- Another new price high and momentum indicator high. This also sets up a buy signal and we look for a pullback trade entry
- Price is ranging and then a breakout occurs. The momentum indicator does not make a new high but price does. We don’t look to trade the next pullback
Are you starting to see how you can use the momentum indicator to design a trading strategy?
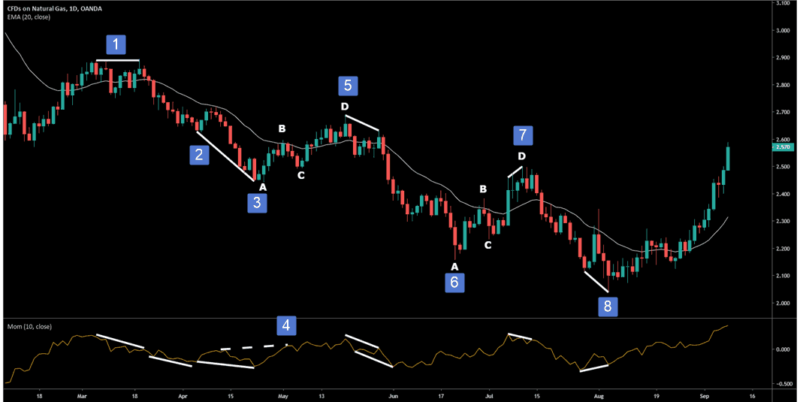
Let’s take a look at another example and we will use a 20 period exponential moving average for trend and pullback location.

- Price has pulled back to the EMA and is above and below the average. We consider this a range and with the double top, we have a lower high in the momentum indicator. Shorting using your sell signal trading entry triggers – could simply be a market entry when price begins to drop from the high.
- Small pullback is a trade as you also see the declining momentum indicator along with price.
- Lower lows in price and indicator. Keep in mind rule of alternation (alternate simple and complex pullbacks)
- Note the higher high in momentum yet not in price? Even though price is at the average, you would not take this trade as you would be expecting higher prices
- Price tops out and while price makes a higher low, the low in the indicator at “C” is lined up with the low in the indicator at the higher low. Short trade on the breakdown
- Complex pullback as momentum indicator rises
- Lower high in momentum while slightly higher high in price. Expect breakdown in the overall direction of the moving average
- Lower lows in price while higher lows in momentum. Expect higher prices as divergence occurred.
How To Enter The Momentum Confirmed Trades
If you determine a trading opportunity, how do you enter the trade?
There are several simple methods and while the trade entry is important, more so is risk and trade management.

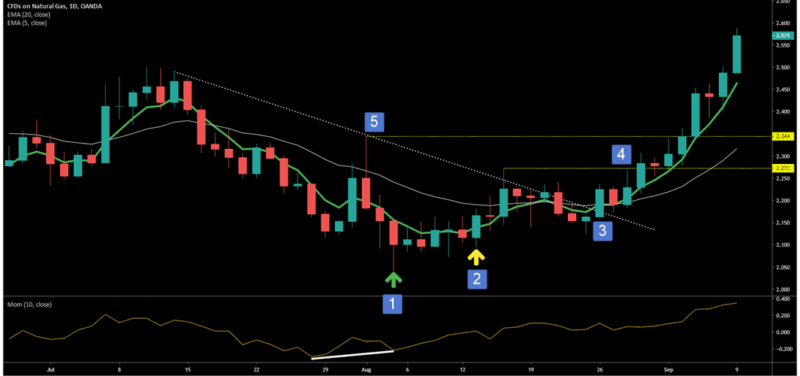
The security is showing bullish divergence with lower prices and higher momentum readings. Assume you want to trade the move higher with the anticipation of a short term trade. Considering the down trend in price, that is a smart play until you see the trend changing direction.
- This is a reversal type of candlestick. You can set an order to buy the break of the highs at this price point
- Using a 5 period EMA, you could buy when price closes above the average
- This is a trend line and once price breaks and closes above it with obvious bullish intentions, you can buy
- Remember that a down trend needs lower lows and lower highs. We put in a higher high at #3 and you may consider this an obvious previous high. Buy the break
- This high may stand out to you more and would confirm to you an uptrend upon break. You could position just before the break of this high (price action dependent) or buy the break
Stops And Targets
I prefer to use the average true range to determine stop locations. You can use any multiple however I prefer starting at 2 X ATR and adjust around price swings.
You could use below swing points for longs and above swing highs for short trades.
Some traders prefer to trail their stop loss location and even scale out partial positions at 1R (1 times your risk). We can never know in advance how far price will move in our favor so reducing risk and taking profits in a structured and consistent way is advised.
Can we use bullish and bearish divergence as a means of reducing risk or exiting the trade? Sure. Imagine you were short heading into the lows marked #1 in the last chart. You may use that bullish divergence to exit the short position.
There are many ways we can take profits and set stop losses. Read through this trading tips blog for more examples.
Momentum Indicator Wrap
Using the indicator as a means to qualify price moves to trade is a sound trading strategy.
In pullback trading, we need to see an impulse move having momentum and the momentum oscillator indicator is good at point those moves out.
- Look for the momentum indicator to make a new high in a trending market.
- Let the pullback begin (corrective move) and terminate around a balance point – 20 EMA, 50 EMA
- Use an entry such as price action or trend line break and use ATR to set your stop loss
If you want to trade breakouts:
- Look for a range to form with obvious support and resistance points
- Look for the breakout to occur
- Ensure the momentum indicator has made either a new high or new low depending on the break
Trading does not have to be complicated. Ranges and pullbacks are every day market occurrences which makes them great trading strategy material. Adding in the momentum indicator can help you set a rules based trading approach to your trading business.
There may be momentum or macd indicator settings for day trading that you may experiment with. I generally stick with the default settings for all indicators.
