- October 6, 2025
- Posted by: CoachMike
- Categories: Options Trading, Swing Trading, Trading Article

Most retail traders base their trading decisions off price action on the charts. The big decision that has to be made in doing so is what time frame will be used on the charts?
Is it best to use the daily chart? The hourly chart? What about the 130 minute time frame?
The answer depends on your outlook for the overall market and for that individual trade.
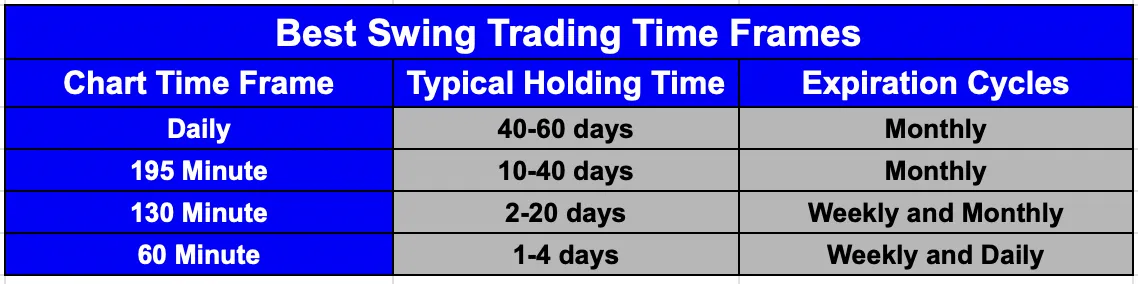
In this article, we will focus on the best time frames for swing trading. We are looking for different types of swing trades at NetPicks that can range from having holding times of 1-4 days on up to 40-60 days.

Swing Trading The Daily Chart
The daily chart is used often with traders and investors to determine overall market direction. It can be used to reference key support and resistance levels which is helpful when both entering and exiting the positions.
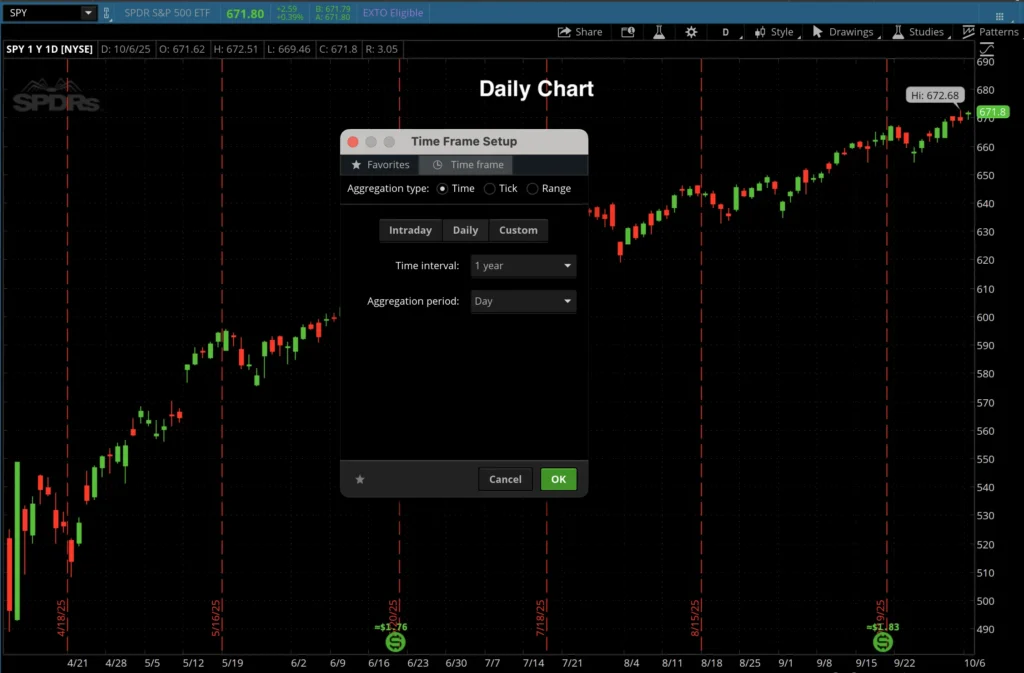
The benefit of the Daily Chart is it can filter out some of the noise that can kick in on some of the shorter time frames like an hourly chart. This will help you avoid getting caught up in the short term swings and focus on a longer term hold.
The downside to a daily chart is it can oftentimes require a bigger directional move to hit a desired target level. It is slower to react to price swings, which can require a longer term approach.
We find the daily chart works well if you plan on holding your trades for weeks or even months.
We will use a mix of long options and credit spreads when using the daily charts but primarily focus on the monthly options with these trades. These options typically have 40-60 days left to expiration.
195 Minute Chart
The 195 minute chart is one that we have used a lot over the years. Instead of only getting one candle each day like on a daily chart, you will get 2 candles each day. We like to set up our 195 min charts so we get a candle at 9:30 and 12:45 eastern time each session.
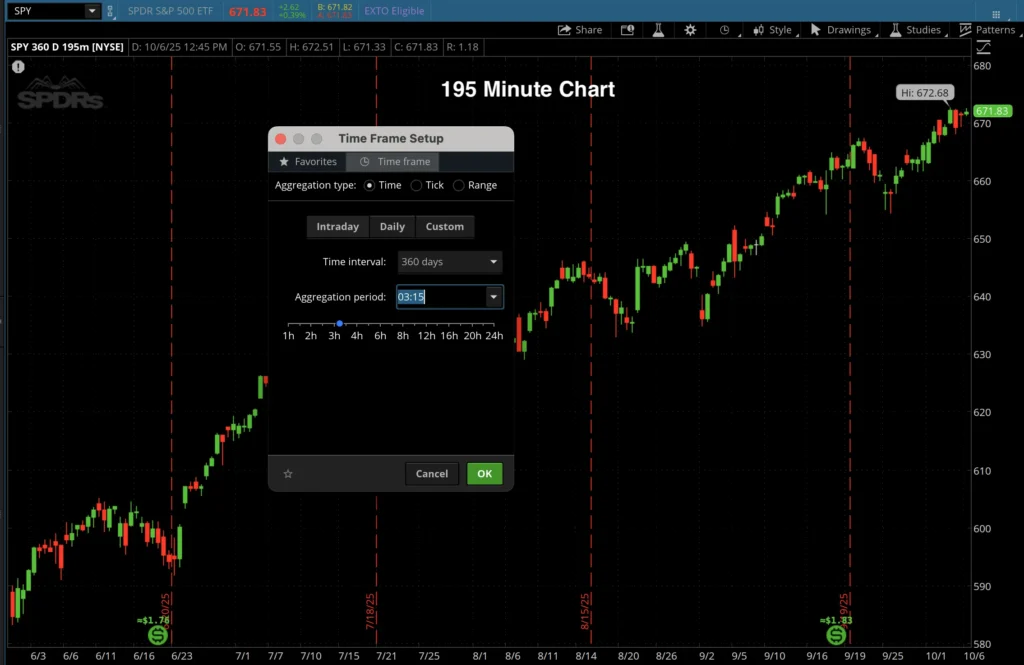
The big benefit is that this timeframe will speed things up vs the daily chart. It doesn’t require a lot of time to track the charts on a daily basis but it will help your system respond quicker to changes in price.
We prefer the 195 minute chart to the daily timeframe when we are looking to longer term swing trades. With this timeframe we are typically looking to hold our trades for 10-40 days.
We will use a mix of long options and credit spreads when using the 195 minute time frame but primarily focus on the monthly options with these charts. These options typically have 40-60 days left to expiration.

130 Minute Chart
The 130 minute chart is our primary time frame that we use with our swing trades. We find that it keeps us much more active vs the daily or 195 minute charts. This allows us to react quicker to changes in market conditions.
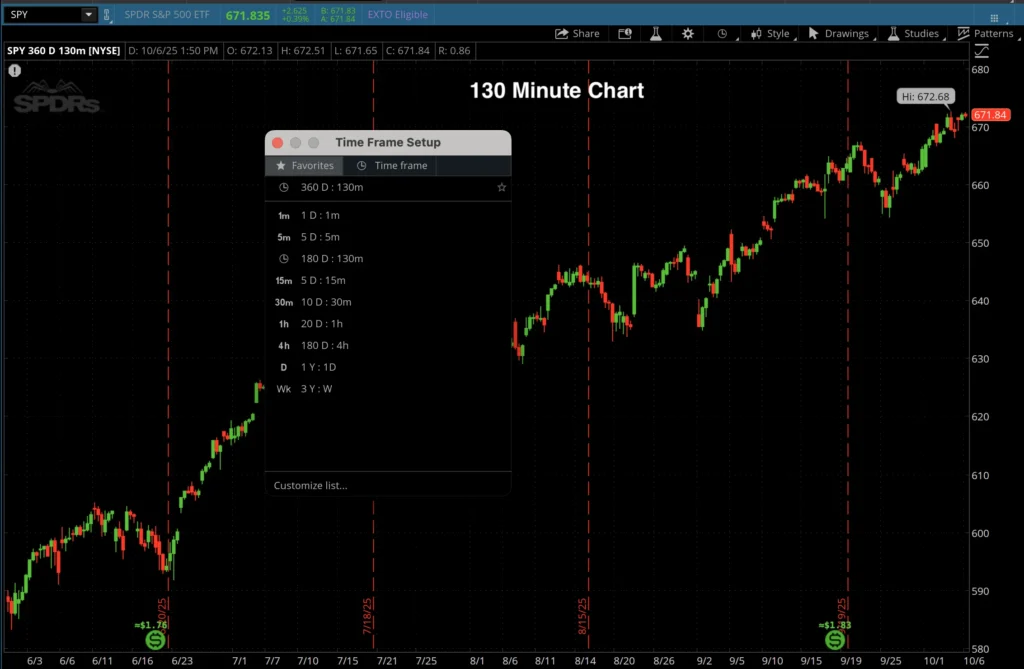
The 130 minute chart will give you 3 candles every session. It will give us a candle at 9:30, 11:40, and 1:50 eastern time.
We also find that the 130 minute chart identifies the swings really well without getting us caught up in choppy conditions. It keeps us active with a typical holding time of 2-20 days. That is our sweet spot in what we are looking for in our swing trades.
We will use a mix of weekly and monthly options as well as a mix of long options and credit spreads when using the 130 minute time frame. In many cases, we are looking at the options that have 20-40 days left to expiration when entering the trades.
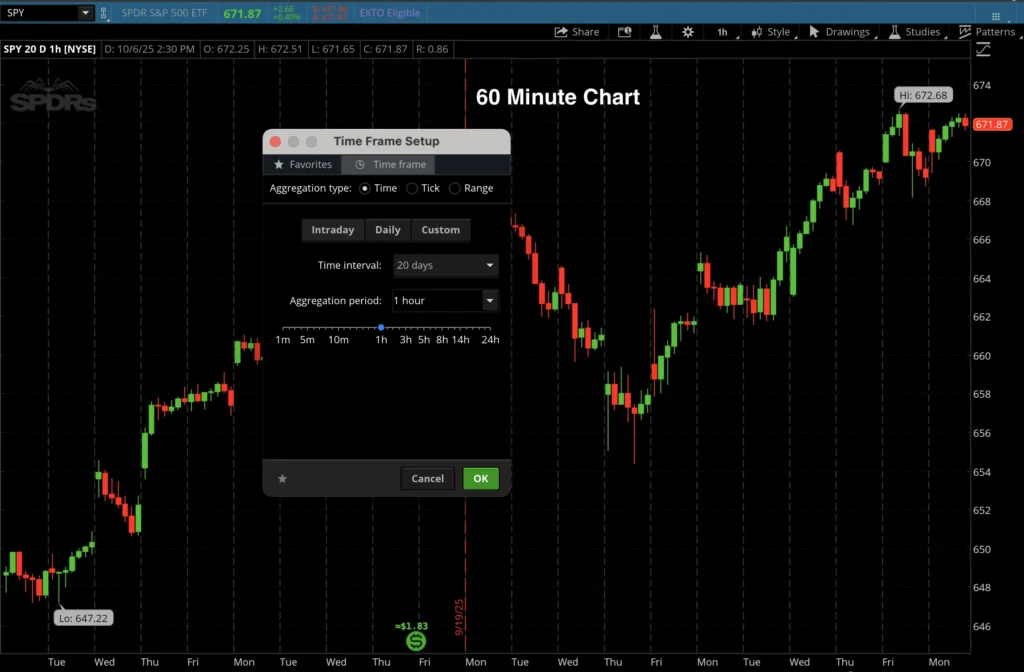
60 Minute Chart
The hourly time frame can be used when you are looking for the shorter term swing trades. We use this chart for our Weekly Gems trades where we are looking for trades with a typical holding time of 1-4 days.
When going to the 60 minute charts, we prefer to use more credit spreads as we are typically taking our trades using shorter term weekly or even daily options. As a result, the time decay is more extreme. By using the credit spreads, we are able to get the time decay working in our favor.
If using long options based on the hourly chart, you need to be highly confident of a directional move taking place quickly. In an active market, that approach can work really well. Just make sure you are doing so in an active market environment that has good range and volatility.

We will typically use options that have 3-12 days left to expiration when taking trades based on the 60 minute charts.
Summary
The 4 time frames are all good options to consider when looking for swing trades. The 130 minute and the 60 minute charts are the ones we use most at NetPicks. They keep us active and allow us to take a more diversified approach with our trading.
| Chart Time Frame | Typical Holding Period | Use Case | Option Types Used | Notes |
|---|---|---|---|---|
| Daily Chart | Weeks to months (40-60 days) | Overall market direction, longer-term swing trades | Long options, credit spreads—monthly options | Filters noise, slower to react, good for longer holds |
| 195 Minute Chart | 10-40 days | Moderate-term swing trades | Long options, credit spreads—monthly options | 2 candles per day, faster response than daily |
| 130 Minute Chart | 2-20 days | Primary time frame for active swing trades | Weekly and monthly options, both long and credit spreads (20-40 days expiration) | 3 candles per session, balances activity and noise |
| 60 Minute Chart | 1-4 days | Short-term swing trades, Weekly Gems | Mainly credit spreads with weekly/daily options (3-12 days expiration) | Fast reaction needed, time decay critical |
The key is to stay consistent with your approach. Once you find your sweet spot, don’t jump around to different time frames on a daily or weekly basis. Be slow to change as it will help you see more consistent returns from your trading.