- April 22, 2025
- Posted by: Shane Daly
- Categories: Advanced Trading Strategies, Day Trading, Trading Article, Trading Tutorials
You can master the Bollinger Band Squeeze technique by watching for when Bollinger Bands contract inside Keltner Channels, signaling low volatility. This compression acts like a coiled spring – the tighter it gets, the more powerful the eventual price movement. Look for narrowing bands with 95% of prices staying within range, and confirm your trades with volume analysis and momentum indicators. Learn these key components to spot high-probability trading opportunities before major market moves unfold.
Quick Overview
- Identify a squeeze when Bollinger Bands contract inside Keltner Channels, signaling potential significant price movement ahead.
- Wait for band expansion and increased trading volume to confirm breakout direction before entering trades.
- Use RSI and volume indicators alongside the squeeze pattern to validate the strength of potential breakouts.
- Implement strict risk management by setting stop-losses at 1-2% and defining clear entry and exit points.
- Start with smaller position sizes during the squeeze, then scale up positions once the breakout direction is confirmed.

Bollinger Bands Explained
Bollinger Bands are a trading indicator from John Bollinger and are the first component and they measure the movement of closing prices around a moving average. The moving average is the middle band.
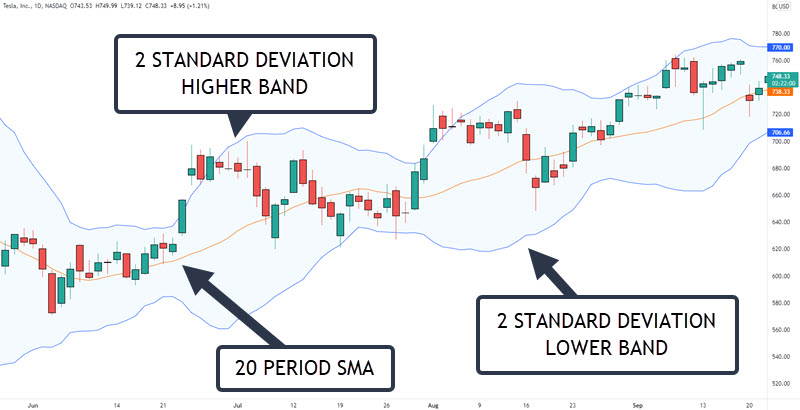
The standard deviation of this movement is calculated and lines are plotted a fixed number of standard deviations above and below the 20-day simple moving average. These are called the upper band and the lower band.
At its core, the Bollinger Band indicator measures the volatility of closing prices. During periods of high volatility, the bands expand and during periods of low volatility, the bands contract.
Typically the bands are drawn 2 standard deviations around the moving average, which means that statistically 95% of the closing prices are contained within the bands.
Keltner Channels
Keltner Channels are the second component and they are similar to Bollinger Bands in their appearance and usage.
The average true range (ATR) of price bars is calculated and the channel lines are drawn a fixed number of ATR’s above and below a moving average of closing prices.
Because the ATR tends to remain fairly consistent, the Keltner Channel does not change much in size.
Similar to Bollinger Bands, the Keltner Channel can be used in both breakout and fading strategies. Typically the channel lines are drawn 1.5 ATR’s above and below the moving average, and the normal interpretation is that price is overbought or oversold as it approaches these lines.
An advantage of the Keltner Channel over Bollinger Bands is that it reacts more quickly to price moves, and as trends develop the channels begin sloping up or down with little lag.
Trading The Bollinger Band Squeeze
Whenever market volatility decreases and our strong trends begin to slow, we see the Bollinger Bands tighten while the Keltner Channel remains relatively constant. As volatility continues to decrease the bands will eventually move inside the channel lines and this is where we become on alert for trading signals.
When volatility increases, the BBands expand.
This means that using the typical default values, 95% of the closing prices fall within 1.5 ATR’s of the moving average, and that is what constitutes a squeeze.
Setting Up The Bollinger Band With Keltner Channel
- Apply the Bollinger Band indicator and set to 20 periods with a standard deviation of 2
- Apply the Keltner Channel with a lookback period of 20 and an ATR multiplier value of 1.5
Looking at this chart of Bitcoin Cash:
- The Bollinger Bands are the green step lines
- The Keltner Channel is the black solid lines
- The rectangles highlight the areas where the bands are contained inside the channel – squeeze setup

Note that during these periods, price chops around in a narrow range until a breakout movement eventually ends the squeeze.
If you are a day trader presented with this information you may decide to sit on the sidelines until the squeeze is over as the bands show you are in a choppy market.
Traders may want to watch support and resistance levels when the squeeze is showing signs of ending. Many traders like to play the breakout expecting that the coiled energy in the squeeze will lead to large price movements.
Using the default values for the indicators (2 standard deviations, 1.5 ATR’s and a 20-period moving average) we get the results we see above.
Is It A Perfect Indicator?
The squeeze is not the Holy Grail. It has 3 limitations:
- The first and more serious limitation is that it’s a lagging indicator. It will only tell you that you’re in a squeeze after the consolidation has already started, and it will tell you that the squeeze is over only after the breakout move has already taken place.
- The second limitation is that the squeeze is not a directional indicator. When the squeeze is over you it doesn’t tell you in which direction price will move, you’ll have to determine that from the price action itself or by combining the squeeze with other directional indicators. This is not much of an issue if you’re trading manually but does have an impact if you develop an automated strategy.
- It doesn’t offer trading signals
I have to remind you again; there is no such thing as the holy grail of trading. At this point, you may want to ignore any buy or sell signal your trading strategy gives you while in the squeeze.
Code Your Own Squeeze Trading Indicator (Tradestation)
Although simple in concept, it can get a bit confusing staring at all these bands and channels on the chart, especially if you have other indicators plotted on your chart.
To help reduce the clutter you could develop a separate indicator for the squeeze and simply remove the Bollinger Bands and Keltner Channel from the chart.
Both indicators are symmetrical, meaning that the upper and lower bands or channel lines are the same distance from the moving average. That means that we can focus on only one side in developing our indicator. In our case, we’ll just consider the upper lines.
The basic formulas we need are:
- Bollinger Band = Moving Average + (Number of standard deviations X Standard Deviation)
- Keltner Channel = Moving Average + (Number of ATR’s X ATR)
Or if we translate this into pseudo-code:
- BBUpper = Avg(close,period) + (BBDevs X StdDev(close,period))
- KCUpper = Avg(close,period) + (KCDevs X ATR(period))
The squeeze is calculated by taking the difference between these two values:
- Squeeze = BBUpper – KCUpper
Which simplifies down to this:
- Squeeze = (BBDevs X StdDev(close,period)) – (KCDevs X ATR(period))
StdDev and ATR are basic functions included in all major charting applications (the names will vary by platform, just dig a little), while BBDevs (number of standard deviations), KCDevs (number of ATR’s) and period (length of the moving average) are your input values.
Whenever the Bollinger Bands are outside the Keltner Channel, the Squeeze indicator will give you a positive value; whenever they are inside the Keltner Channel, the Squeeze will give you a negative value.

This is a USDCHF currency chart with the Squeeze indicator added. I highlighted the areas where the Squeeze goes negative. Notice how they coincide with the Bollinger Bands moving inside the Keltner Channel on the price chart.

You may also consider displaying the Squeeze as a histogram instead of a line, which I find makes it easier to read which you can see below.
Use The Bollinger Band Squeeze To Stay Out Of Choppy Markets
As I stated earlier, the Squeeze indicator is not a Holy Grail. It is instead one more tool for your trading arsenal to help you stay out of choppy trading periods.
Use it as a filter in conjunction with other indicators to enter a trade, or use it as one of several setup indicators.
You can apply it directly to the chart that you’re trading, but I have found it to be extremely effective when applied to a higher time frame chart such as the daily chart.
For example, as a Bollinger band squeeze trade strategy, if you are day trading on a five-minute chart, apply the Squeeze to an hourly or four-hour chart and use that as your chop indicator. You will miss out on some winning trades, but consolidation on higher time frames typically yields very choppy trading on the lower time frame.
Trading in choppy markets can be hazardous to your trading account. The faster you can determine this market state, the faster you can sit on your hands and preserve your trading capital.
Your Questions Answered
How Does Market Seasonality Affect the Reliability of Bollinger Band Squeezes?
You’ll find Bollinger Band squeezes are less reliable during seasonal market shifts, as volatility patterns change. Consider adjusting your trading strategy during known seasonal transitions to avoid false signals.
Can the Squeeze Indicator Be Effectively Applied to Cryptocurrency Markets?
You can apply the squeeze indicator to crypto markets effectively, but you’ll need to adjust for their higher volatility and 24/7 trading. It’s particularly useful during consolidation periods.
What’s the Optimal Timeframe Combination When Scanning Multiple Charts for Squeezes?
You’ll get reliable squeeze signals by scanning 1-hour, 4-hour, and daily timeframes together. When squeezes align across multiple timeframes, they often produce stronger breakout movements.
How Do Earnings Announcements Impact Ongoing Bollinger Band Squeeze Patterns?
You’ll notice earnings announcements can disrupt squeeze patterns due to price volatility. They often trigger premature breakouts or invalidate existing squeezes, so it’s best to avoid trading squeezes around earnings dates.
Which Trading Platforms Offer the Best Tools for Bollinger Band Squeeze Analysis?
You’ll find excellent Bollinger Band squeeze analysis tools on TradingView, ThinkOrSwim, and MetaTrader 4/5. Each platform offers customizable indicators, real-time alerts, and comprehensive charting capabilities for squeeze trading.
Conclusion
You’ve now got the tools to spot and trade the Bollinger Band squeeze effectively. Remember to watch for the telltale signs of tightening bands and confirm your signals before entering trades. While no strategy is perfect, combining these squeeze techniques with solid risk management will help you identify potential breakouts. Keep practicing, stay patient, and you’ll develop confidence in recognizing these profitable trading opportunities.