

- September 12, 2025
- Posted by: Shane Daly
- Categories: Advanced Trading Strategies, Trading Article

You’ve heard about Simple Moving Averages (SMAs) being used in trading, but you might not know how to use their full potential through compression strategies. When key moving averages like the 10, 20, 50, 100 and 200-period converge, they create powerful setups that can signal major market changes. Understanding these compression patterns isn’t just about spotting them – it’s about knowing exactly when to enter and exit trades for maximum profit potential. Let’s explore how you can master these trading techniques.
Video Highlights
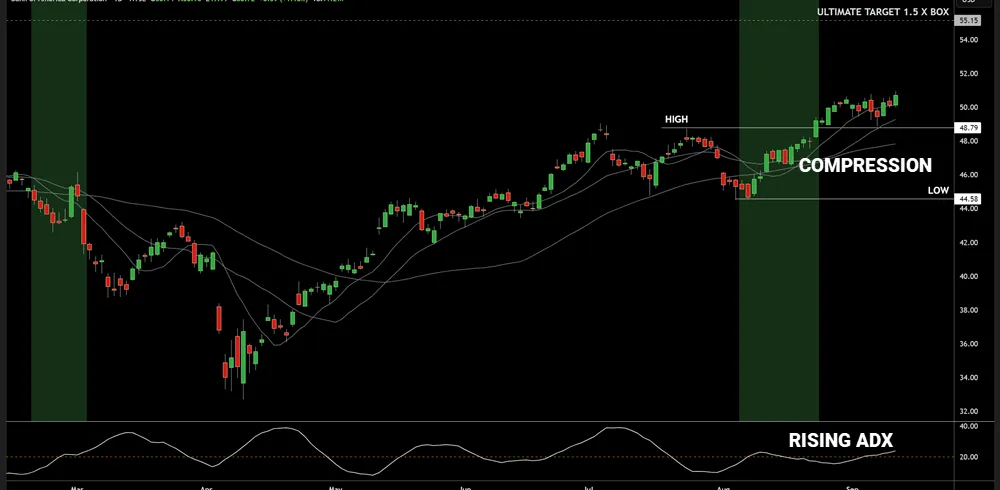
- SMA compression occurs when multiple moving averages converge into a narrow band, signaling potential institutional position building and future breakouts.
- Enter trades after a candlestick closes outside the consolidation box, waiting for the first pullback for optimal entry timing.
- Set targets at 1.5 times the consolidation box height and limit risk to 1% of total account value per trade.
- Combine ADX readings above 20 with SMA compression patterns to confirm trend strength and improve trade success rates.
- Monitor daily charts for compression setups and track results weekly, using RSI-14 for additional confirmation of trade opportunities.
Trading success often depends on your ability to spot potential market moves before they happen. You’ll find that SMA analysis is one of your most powerful tools for identifying these opportunities. When multiple moving averages converge into a narrow band, you’re witnessing what is called a SMA compression – a key signal that market volatility is about to change.
During these periods, institutions quietly build their positions while keeping prices stable, creating a perfect setup for your next trade. You’ll want to focus on using the 10, 20, 50, 100, and 200-period Simple Moving Averages as your primary indicators. In the video above, I speak about which combinations to use together.
When these averages compress into a tight range that’s smaller than the 20-period average true range, you’re looking at a core compression setup. It’s like a spring coiling up – the longer the compression lasts, the more powerful the eventual breakout can be.
To make the most of these setups, you’ll need to draw a consolidation box around the highest high and lowest low of the past 10 bars. Wait for a candlestick to close outside this box, then enter on the first pullback. Your stop loss should be placed on the opposite side of the moving average ribbon, and you’ll want to target a price move that’s 1.5 times the height of your consolidation box.
Risk management is important to your success. Don’t risk more than 1% of your account on any single trade. For instance, if you’re trading with $25,000, keep your maximum loss to $250. This might mean adjusting your position size based on your per-share risk. Remember to monitor the ADX indicator – when it rises above 20, it confirms your trend strength and improves your win rate significantly.
Make this strategy part of your weekly routine by scanning daily charts for setups, tracking potential trades in a spreadsheet, and reviewing your results every Friday. With practice, you’ll develop an eye for these compression patterns and the confidence to trade them effectively. Consider combining your analysis with the RSI 14-period setting to validate trend strength and improve your trading accuracy.
Your Questions Answered
How Do Market Makers Exploit SMA Compression Zones to Their Advantage?
Market makers use SMA trading techniques to accumulate positions during low-volatility compression zones. They’ll quietly build their positions while retail traders get bored and move on from the instrument.
You’ll see they often drive prices to key moving averages, triggering stop losses before making their big moves.
When volume drops and SMAs compress, that’s when they’re most active behind the scenes.
Can SMA Compression Strategies Work Effectively in Cryptocurrency and Forex Markets?
Yes, you’ll see that SMA compression strategies work well in crypto and forex markets because they share similar market psychology patterns.
The key is adapting your timeframes – crypto markets often move faster, so you might need shorter periods for your SMAs. In forex, institutional players create more predictable compression zones.
Remember to adjust your position sizing though, as these markets can show higher volatility than traditional stocks.
What Percentage of SMA Compressions Result in False Breakouts?
You’ll typically see false breakouts in about 35-40% of SMA compression patterns, which is why you need to wait for confirmation signals.
Don’t rush into trades at the first sign of a breakout. Instead, watch for supporting indicators like rising ADX and increased volume.
If you’re getting too many false signals, try extending your confirmation period to 2-3 candles after the initial breakout move. Waiting for the pullback as suggested can reduce the number of failed trades.
Which Time Frames Show the Most Reliable SMA Compression Signals?
You’ll find the most reliable SMA compression signals on daily and 4-hour charts.
Daily timeframes give you better short term predictions because they filter out market noise while capturing meaningful price action.
When you combine these with 4-hour charts, you’ll spot stronger signal strength and clearer breakout patterns.
Weekly charts can show compression too, but they’re often too slow for practical trading decisions.
