
- May 1, 2026
- Posted by: Shane Daly
- Category: Trading Article

Executive Summary
- Relative Strength compares an asset’s price to a benchmark, revealing outperformance before a breakout becomes obvious on price charts alone.
- A flat price with a rising Relative Strength line signals emerging leadership and often precedes a significant price breakout.
- Use appropriate benchmarks like SPY for large-caps or QQQ for tech stocks to generate meaningful, actionable Relative Strength signals.
- Rising Relative Strength filters strong candidates, but always wait for confirmed price action, such as a breakout, before entering trades.
- Avoid confusing Relative Strength with RSI; Relative Strength compares two assets, while RSI measures a single asset’s internal momentum.
What Is Relative Strength in Trading?
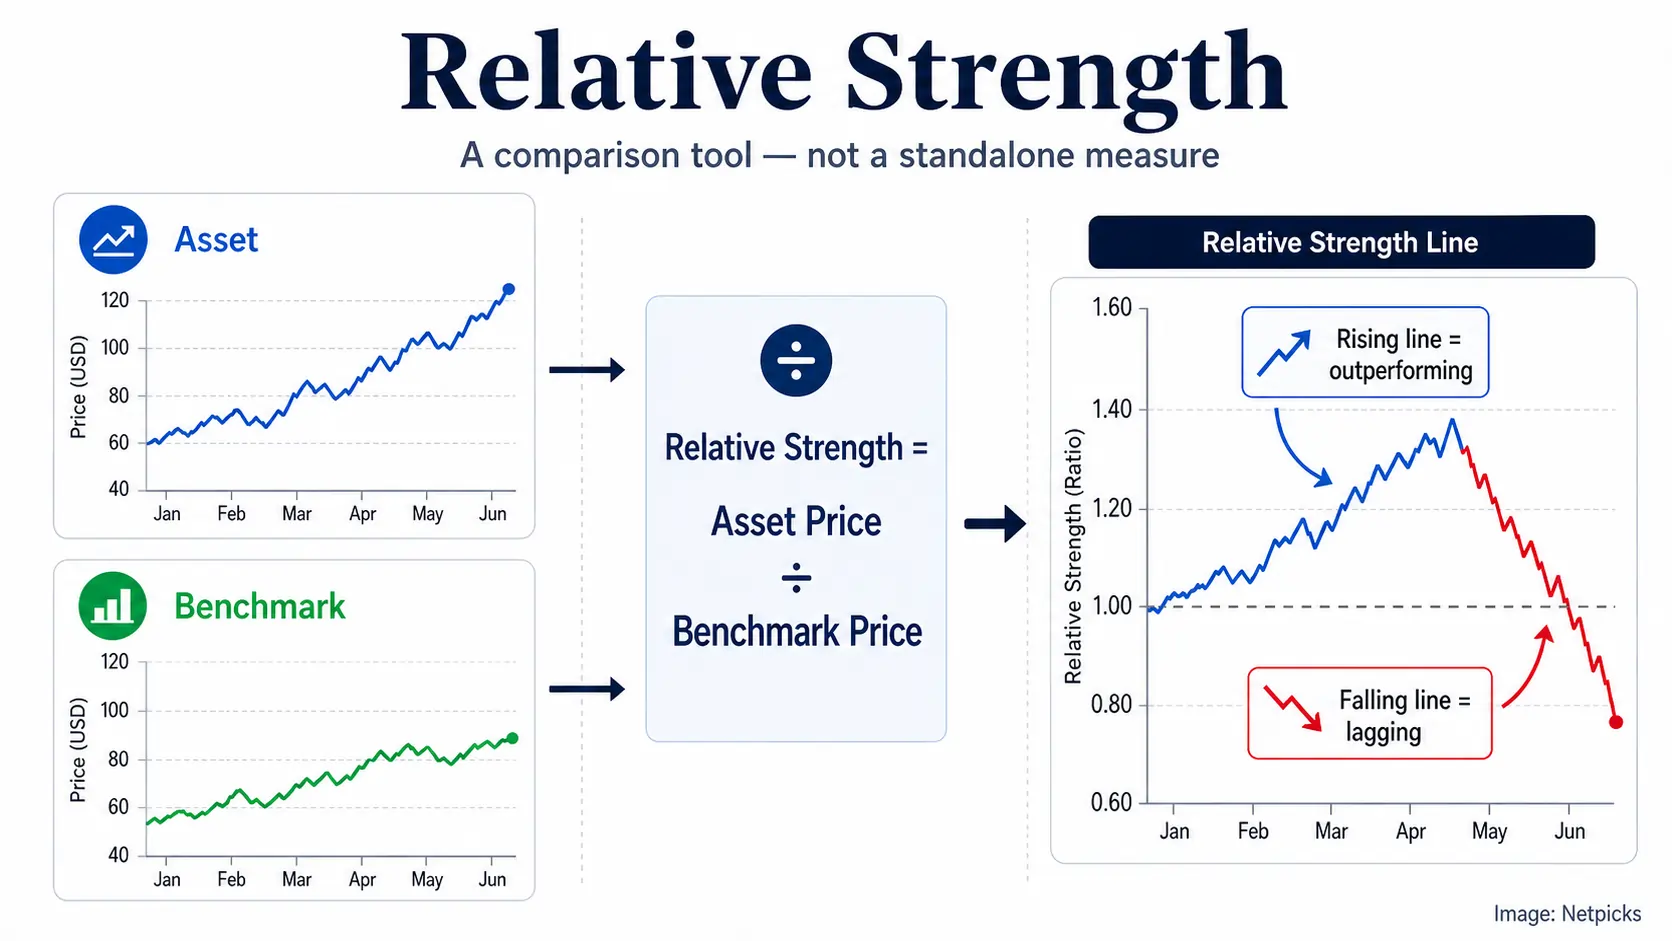
Relative strength is a comparison tool — it measures how one asset performs against a benchmark, not in isolation. The formula is simple: divide the assets price by the benchmark’s price. The result is a relative strength line. When that line rises, the asset is outperforming. When it falls, it’s lagging.
Don’t confuse it with RSI. RSI measures momentum within a single chart. Relative strength measures performance between two assets.
That distinction defines its relative strength importance. You’re not just asking whether a stock is moving — you’re asking whether it’s leading the sector or the overall market.
The practical applications are direct: compare a tech stock to QQQ, a large-cap to SPY, or a crypto asset to Bitcoin. The benchmark must match the asset you’re analyzing.
Relative Strength vs. RSI: What’s the Difference?
Both tools appear on trading charts, but they measure completely different things.
RSI tracks momentum within a single asset. It tells you whether that asset is overbought or oversold based on its own recent price movement.
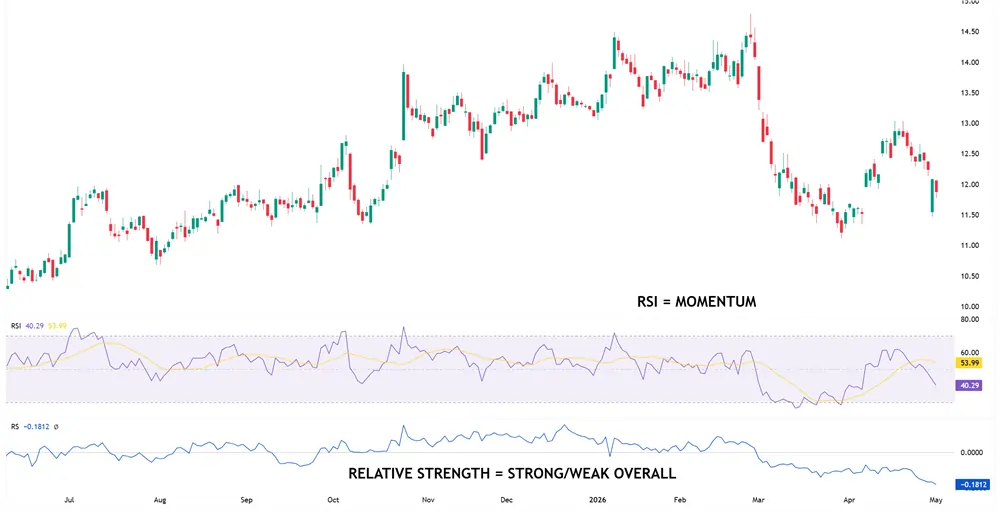
Relative Strength Explained simply means dividing one asset by a benchmark, such as a stock divided by SPY. That ratio tells you whether the asset is leading or lagging its comparison group.
This distinction matters when you’re evaluating the Importance of Leadership before a breakout forms.
RSI won’t tell you if a stock is outperforming the market. Relative Strength will. One measures internal momentum. The other measures comparative performance.
If you confuse the two, you’ll misread what your charts are actually telling you.
Use each tool for its correct purpose.

Why Price Alone Can Make You Miss Breakouts
Knowing the difference between RSI and Relative Strength keeps your analysis accurate, but there’s a deeper problem worth looking at: relying on price alone can cause you to miss breakouts entirely.
Price stagnation creates a psychological blind spot. When a chart looks flat, trader psychology defaults to disinterest. You skip it and look for something interesting.
But market conditions don’t pause during consolidation—relative performance shifts constantly beneath the surface as accumulation in a particular instrument can be happening quietly.
While price sits quiet, an asset can steadily outperform its benchmark. That divergence carries breakout potential that raw price data simply won’t show you.
Pre-breakout signals are pretty clear in the Relative Strength line, not the candlesticks. A rising RS line during sideways price action tells you leadership is forming before the move becomes visible.
Price shows movement. Relative Strength shows who’s actually winning.
How to Calculate Relative Strength
Once you understand why Relative Strength matters, calculating it’s straightforward: divide the asset’s price by the benchmark’s price. That single ratio produces a line you can track over time.
Relative Strength = Asset Price ÷ Benchmark Price
When you’re calculating ratios for performance comparisons, the benchmark must match the asset. Use SPY for large-cap stocks, QQQ for tech stocks, a sector ETF for sector plays, and Bitcoin for crypto assets.
The resulting line tells you one thing: is the asset gaining or losing ground against its benchmark?
When the line rises, the asset outperforms. When it falls, the asset lags.
You don’t need complex indicators. One division, the right benchmark, and consistent tracking gives you a reliable filter for identifying leadership before price confirms it.
How to Choose the Right Benchmark
The benchmark you choose determines whether your Relative Strength line means anything. Poor benchmark selection produces misleading signals. Accurate comparative analysis requires matching the asset to its natural competitive category.
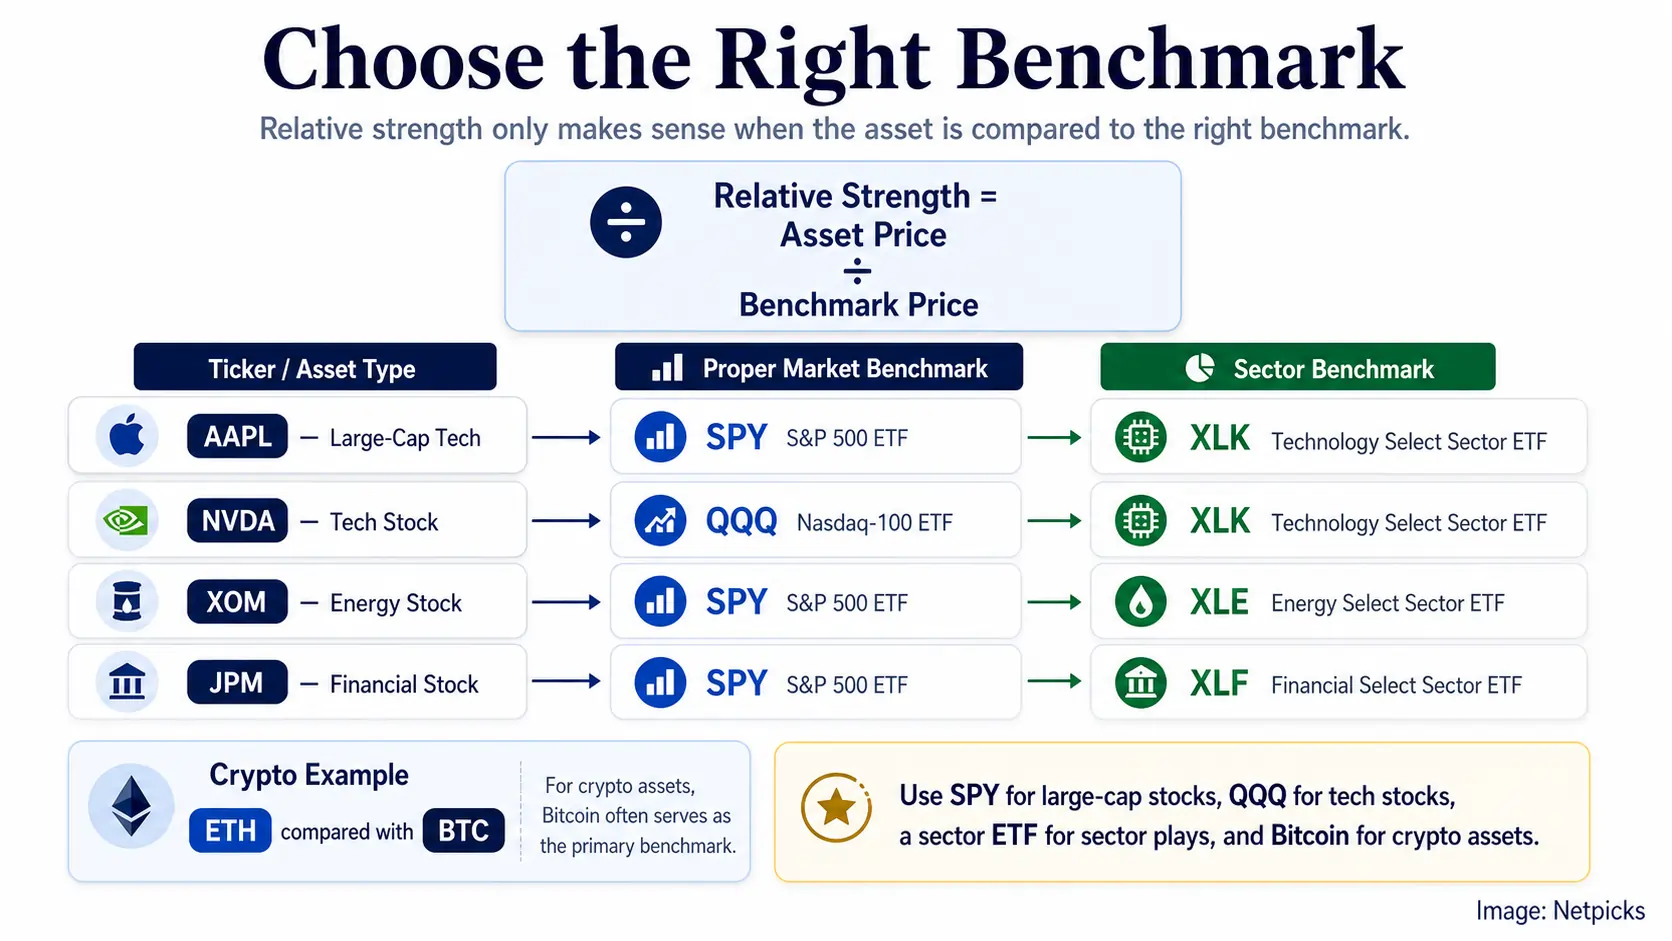
The logic is clear. You’re measuring whether an asset is leading or lagging within its relevant universe. Comparing a semiconductor stock against Bitcoin produces noise, not any insight that will improve your trading.
Before building your watchlist, confirm your benchmark makes contextual sense. A rising Relative Strength line only carries weight when the comparison is appropriate.
Get the benchmark right first. Everything built on top of it, your watchlist, your setups, your entries, depends on that one foundational decision.
The Key Setup: Flat Price With Rising Relative Strength
With your benchmark locked in, you can start evaluating what the Relative Strength line is actually telling you.
The key setup in any breakout strategy is deceptively simple: price is flat, but Relative Strength is rising. The stock sits in a tight range, making nothing look exciting on the surface. Most traders scroll past it.

That’s exactly when leadership indicators matter most. A rising Relative Strength line means the asset is outperforming its benchmark while price consolidates. Strength is building quietly before the breakout becomes obvious.
This doesn’t signal an immediate entry. It signals attention. Add the stock to your watchlist and monitor it closely.
When price eventually moves toward resistance, you’ll already have confirmation that leadership was present before the trigger appeared.
Warning Sign: Rising Price With Falling Relative Strength
Not every rising chart deserves your attention. When price climbs but Relative Strength falls, you’re likely watching a rising wedge — a chart pattern that frequently signals potential reversal. The asset isn’t leading; it’s being carried by broader market sentiment. That distinction matters for your breakout strategy and risk management.

Trading psychology often pulls you toward visually strong charts, but volume analysis can expose the weakness underneath. If volume is thinning as price rises and Relative Strength deteriorates, institutional participation is likely declining. That’s a warning, not an opportunity.
Before chasing a move, ask whether the asset is genuinely outperforming its benchmark or simply drifting higher with the market. A rising candle without Relative Strength leadership is a setup worth skipping.
A Simple 3-Step Relative Strength Trading Method
Three steps separate traders who use Relative Strength effectively from those who use it the wrong way. Build these into your trading strategies and you’ll filter stronger candidates faster and have a more complete watchlist.

Step 1: Choose the Right Benchmark Match the benchmark to the asset. Compare large-cap stocks to SPY, tech stocks to QQQ, and crypto assets to Bitcoin. Wrong benchmarks produce misleading Relative Strength indicators.
Step 2: Look for Rising Relative Strength A rising Relative Strength line means the asset is outperforming its benchmark. Prioritize these charts for your watchlist, especially when price still looks quiet.
Step 3: Wait for a Price Setup Relative Strength filters candidates. Price action creates the entry. Wait for a breakout, pullback, or resistance break before acting.
Relative Strength builds the watchlist. Price defines the trade.
Example: How Relative Strength Can Reveal a Breakout Candidate
Consider this scenario: a stock consolidates in a tight range under resistance. Price looks dull. Most traders scroll past it as a market moving sideways.

But you notice the Relative Strength line quietly trending higher. That stock earns a watchlist spot.
Here’s what you’re tracking:
- Price holds steady while the broader market dips
- Relative Strength line rises consistently during consolidation
- Volume remains controlled, showing no distribution
- Price approaches range resistance
- Breakout triggers your entry rule with leadership already confirmed
That’s market timing done systematically. You aren’t chasing excitement as you do with a ripping momentum stock. You identified leadership before the crowd noticed, entered with confirmation, and let both signals work together.
Common Mistakes When Using Relative Strength
Even experienced traders make avoidable errors when applying Relative Strength, and those errors often turn a useful filter into a misleading one. The first mistake is treating Relative Strength as a buy signal. It isn’t. It identifies candidates worth watching, not entries worth taking.
The second mistake is choosing the wrong benchmark. Comparing a tech stock to SPY instead of QQQ produces a distorted signal.
The third mistake is confusing Relative Strength with RSI. They measure entirely different things.
Finally, trading psychology creates a fourth error: impatience. When Relative Strength rises while price stays flat, many traders either buy too early or abandon the setup before price confirms. Discipline matters here. Let Relative Strength build your watchlist, then wait for price to provide the actual trigger.
Final Takeaway: Use Relative Strength as a Filter, Not a Signal
Knowing what not to do with Relative Strength is only half the equation. You also need a clear framework for applying it correctly within your breakout identification process.
Use relative strength analysis as a filter, not a trigger. Price action still controls your entry.
Here’s what that looks like in practice:
- Filter first: Rising Relative Strength narrows your watchlist to leaders.
- Wait for confirmation: Price must break out on its own terms.
- Match your benchmark: Wrong comparisons produce misleading signals.
- Separate tools: Relative Strength isn’t RSI — don’t confuse them.
- Stay disciplined: A strong RS line without a price setup means you wait.
When both signals align — leadership building quietly, then price confirming — you’re acting on evidence, not excitement.
The Knowledge Gap
Can Relative Strength Be Applied Effectively to Short Selling Strategies?
Yes, you can apply Relative Strength effectively to short selling strategies. When you spot falling Relative Strength against a benchmark, you’re identifying underperforming candidates worth targeting.
Use technical indicators to confirm weakness, then focus on timing entries near resistance levels. Strong risk management protects your trade execution when market psychology shifts unexpectedly.
A consistently declining Relative Strength line gives your short selling approach a systematic, data-driven edge before price collapses become obvious.
How Often Should You Recalculate or Update Your Relative Strength Comparisons?
You should update your relative strength comparisons daily if you’re actively trading. Recalculate using consistent historical data windows — typically 3, 6, or 12 months — against your performance benchmarks.
Weekly updates work for swing trading, but daily recalculation keeps your watchlist accurate. Stale relative strength readings can mislead you into holding underperformers.
The update frequency you choose should match your trading timeframe, not convenience.
Does Relative Strength Work Differently Across Various Timeframes Like Weekly Charts?
Yes, relative strength works differently across trading timeframes.
On weekly charts, you’re analyzing weekly performance over extended periods, which filters out short-term noise and reveals stronger historical trends. Daily charts capture faster momentum shifts, while weekly timeframe analysis confirms sustained leadership.
You should align your relative strength comparisons to your trading style—swing traders prioritize weekly signals, while day traders rely on shorter intervals to identify emerging strength before it becomes obvious.
Can Relative Strength Signals Be Combined With Volume Analysis for Better Confirmation?
Yes, you can combine relative strength indicators with volume confirmation techniques for stronger signals.
When you see rising relative strength alongside expanding volume, you’re watching genuine accumulation, not just random price noise. If relative strength climbs while volume stays flat, treat it cautiously.
But when breakout price action, improving relative strength, and surging volume align simultaneously, you’ve got three confirming data points reinforcing the same thesis, making the setup considerably more reliable.
Are There Specific Market Conditions Where Relative Strength Becomes Less Reliable?
Yes, relative strength becomes less reliable during extreme market volatility, when panic-driven selling distorts all comparisons.
During rapid sector rotation, you’ll see misleading signals as capital shifts broadly across sectors. Sudden economic indicators like unexpected rate decisions can temporarily override individual stock leadership.
Trading psychology also plays a role—fear and greed episodes cause correlated moves that make relative comparisons temporarily meaningless.
Use additional confirmation tools during these conditions.
Next Move
Relative Strength won’t tell you exactly when to buy. What it does is narrow your list to the stocks already proving themselves against the market before a breakout happens. You’re not chasing momentum after it’s obvious. You’re identifying it while it’s still building. Use Relative Strength as your first filter, confirm with price action, and you’ll consistently position yourself ahead of the crowd.