- October 27, 2020
- Posted by: Shane Daly
- Category: Trading Article
This is a simple day trading strategy using one hour charts, the MACD and three exponential moving averages.
I went into detail on this blog post about the MACD and in this strategy, it will act as an indication of trend direction/momentum direction. Our EMAs will act as a line in the sand, direction, as well as triggers into the trade once they set up.
You will learn how to apply this strategy as more of a day trading approach which is useful if you don’t like holding risk overnight. It is possible to expand it into a swing trading style as well as other time frames so knowing yourself as a trader is vital to design your trading approach.
MACD Indicator Settings + Moving Average Length For Day Trading
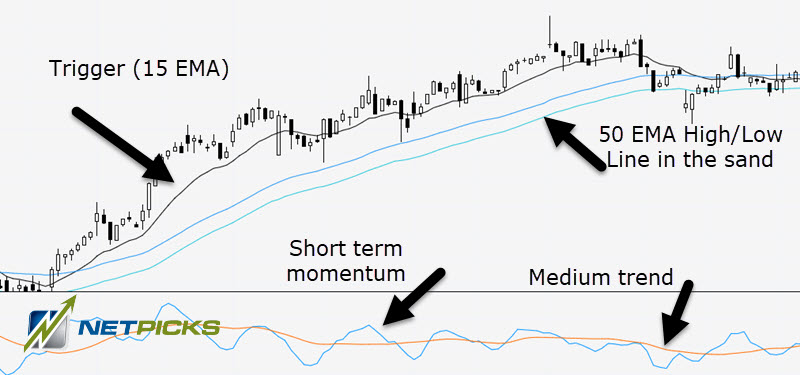
You are going to use a modified MACD otherwise known as the 3/10 Oscillator. That setting is helpful in knowing the short term momentum as well as the medium length trend direction.
In this intraday trading strategy, we will use the following settings for the moving averages:
- 50 period EMA of highs
- 50 period EMA of lows
- 15 period EMA closing values
Our MACD as mentioned previously, will have different day trading settings than you would normally see:
- 3 fast line
- 10 slow line
- 16 smoothing
- Using simple moving average formula if available
- We won’t be using the histogram for this strategy (you can if you choose to)
How do you use the indicators?
The 3 period blue line, the MACD line, is used to show our short term momentum indicator for the market. Once the line hooks in either direction, the momentum, on a short term bases, is in that direction
The 10 period orange line, the MACD signal line, is used for the medium term trend direction. We won’t use that primarily but you may find the odds of successful trades increase slightly when it is in your direction.
The two 50 EMA lines form a channel and the slope can give another indication of market momentum. We will consider pullbacks into the channel but we do not want to see the 15 EMA inside the channel when trading
The 15 EMA is our conservative trade trigger. Once price closes below the average, we need price to break to the opposite direction for a conservative trade entry. If we find the moving average inside the channel, especially travelling sideways, we will consider it either a range bound market or one in trend transition.
MACD Intraday Trading Strategy
(Buy Trade Rules – Sells Are Opposite)
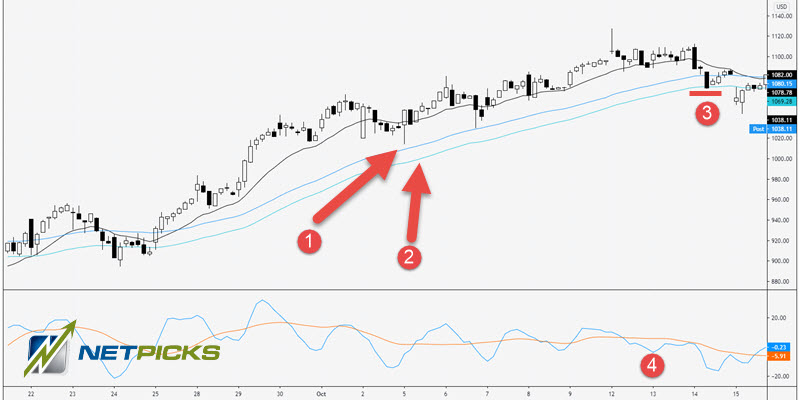
The first questions we must ask is “where is price?”
- If above the 50 EMA channel, we prefer long trades
- If price is below the 50, we prefer short positions
- Has priced pulled back below the 15 period EMA?
On this stock chart, price is above the channel and for some of it, above the 15 EMA. We need price to pull back below the 15 EMA which it does in the green circle.
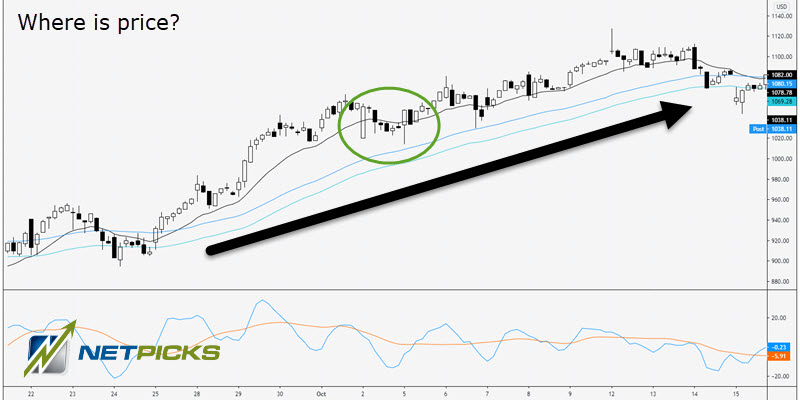
This is our setup. We are in an uptrend and price has given us a pullback below the 15 EMA and a close.
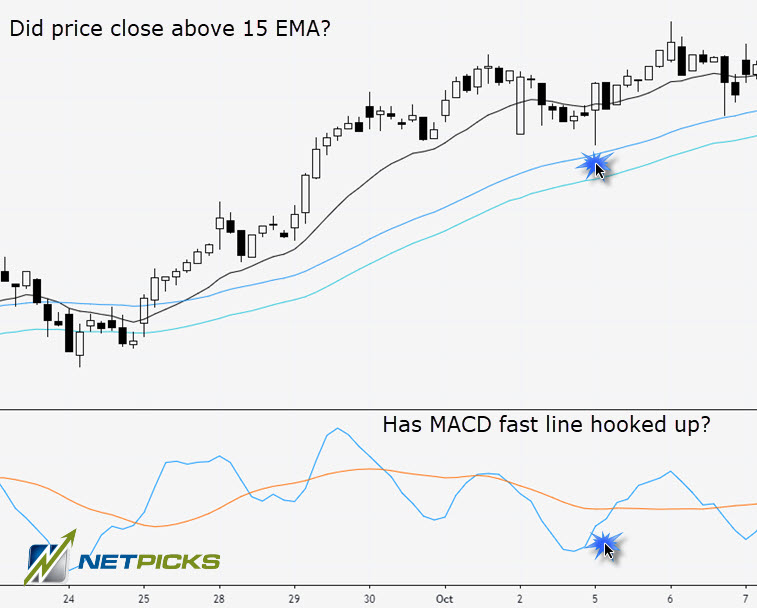
Now we need to see an entry trigger and our trigger is simple:
- Price closes above the 15 EMA
- The MACD line, the fast line, is turning upwards
- Your entry price can be at close or a buy stop order just above the high
You can see that price has closed above the moving average and we see a hook up in the fast line of the MACD:
A setup and entry is part of the plan but without a way to exit, we have nothing. So, let’s work on stop loss locations and ways to take our profits.
Profit Target and Stop Loss Locations
Risk management and saving your trading account from devastating losses should be job number 1 for a trader. You will have several options but you must choose what suits your comfort level.
One rule of the thumb is don’t make losses bigger than your profits. If you grab small profits but take full losses or worse, larger losses than initially risked, your career will be short.
Keeping things simple in trading generally means you are more apt to follow the plan.
- Placing a stop loss below a swing low for longs plus a buffer is an easy way to set a stop. You may even consider using the 1X ATR (average true range) subtracted from the low of the trigger candle to add some wiggle room
- In a long trade, consider using the bottom of the channel for the initial stop distance.
- For an exit when taking profits, you could trail your stop loss up the bottom of the channel
- Using the MACD line, once the indicator puts in a lower low, consider that has an exit signal or to place your stop just under the lows of price
- Pure price action where reversal chart patterns begin to show up
Whatever you use, consistency matters.
Let’s take a look at another chart…..
Trading Forex – MACD Strategy
There is no trading strategy that strings 100% wins so let’s take a look at Forex and the strategy in action.
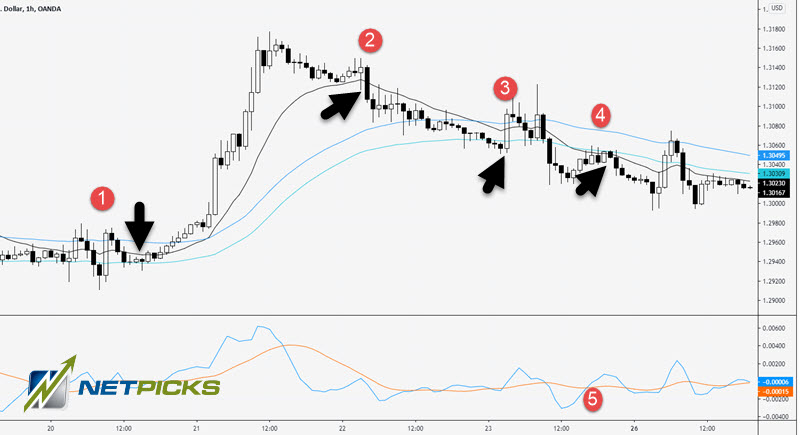
This is a great chart to show a few things including a losing trade.
- Having the no go signal of the 15 EMA heading through the moving average channel keeps you out of the chop.
- First time we get our setup as this candle closes below the 15 EMA
- Candle pops up and closes over our entry trigger. You may see the 15 EMA inside the channel but note the hook in the average showing momentum joined the party
- Short setup as price closes above and then below the trigger. Short trade that gets a drop of 53 pips
- Note the low on the MACD when priced moved down. This shows momentum to the downside.
I picked one of the ugliest charts I could quickly find to show that it won’t always be smooth sailing.
Pro Tip: Notice back at number 5 that the MACD made a new momentum low on that downswing. This tips the odds to sell the next pullback as momentum is showing to the downside.
Tweak and Refine
There are opportunities to tweak this strategy including using trend line breaks in addition to the moving average trigger.

Here you see price close below the 15 EMA and then break an upsloping trendline at the same time we get the blue MACD line crossing the signal line.
Another refinement is using the 15 EMA for trade management. If short and price closes above the 15 EMA consider scaling out partial position. If price continues to rise, you’ve made a profit on the trade depending on how you manage the trade.
If price breaks down, you can re-enter and rejoin the move.
I would not add any more technical indicators to the mix but would consider adding more chart reversal/continuation chart patterns.
Summary
The MACD one hour trading strategy is a simple approach to trading pullbacks.
Combining momentum and trend, you have the opportunity to catch some strong momentum trends.
You may want to consider swing trading as well. I presented this as a day trading strategy as many do not like holding positions overnight.
As will any strategy, write down and test your rules before risking real money.