- May 7, 2021
- Posted by: Shane Daly
- Category: Trading Article
The Know Sure Thing indicator is another in the list of momentum oscillators that uses Rate of Change and simple moving averages to make the calculation.
What makes this indicator interesting is that it uses four different periods and then calculates it into one output.
As an oscillator, the Know Sure Thing Indicator can be used in much the same way as any other momentum oscillator:
- Crossovers of the two lines
- A crossing of the zero line
- Finding price divergence on the chart
What about oversold and overbought readings?
There are no upper or lower limits such as 20 or 80 which makes looking for OS/OB, a waste of time. The issue is you have no reference point to show you the market is potentially in one of those states.
I will say it now that using just an indicator for buy and sell signals is, in my opinion, not the best use of an indicator. Using some type of price action will go a long way in giving you a viable trading strategy.
Calculate The Know Sure Thing Indicator
As mentioned, we are looking at four different periods with the Rate of Change (ROC) and using a simple moving average calculation (SMA)
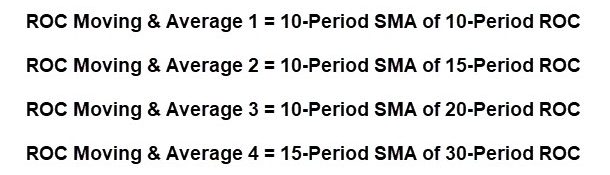
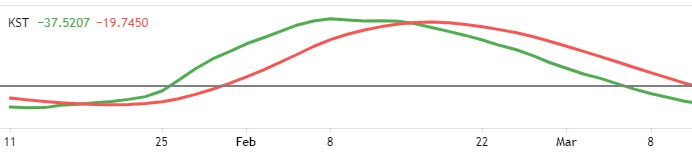
Once those are calculated giving us a smoothed Rate of Change reading, we take a 9-period SMA of the Know Sure Thing and that is our signal line (red line above).
All of the inputs can be edited though it is recommended to start using the default settings. Trying to find perfect settings is time better spent working on a trading plan.
Markets change and the perfect setting in the market of today, could be vastly different next week. Granted, there are traders who would not mind “tuning” an indicator however for me, it’s not something I am interested in.
Understand How The Know Sure Thing Indicator Works
The standard approach is using a cross of the zero or a cross of the two lines as a bullish or bearish sign.
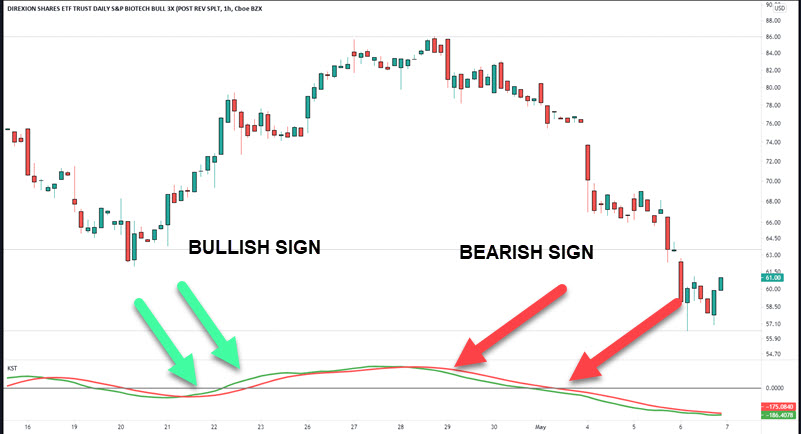
Remember this is measuring momentum in the instrument and you would use whatever tools and tactics you have to enter trades.
Once these KST indicator shows a bullish or bearish market, you want to see, depending on your usage:
- The cross of the lines holding in the same direction as the crossover
- The indicator holding above or below the zero line and either rising or falling
Since we are seeing an increase in momentum, you’d be looking at a trend trading strategy to enter the market.
What if the signal does not hold and we start to see lines mixing together?
Converging Of The Lines
When the lines begin to intertwine, you could be looking at a trading range.
On this one hour stock chart, you can see price is in a range and the indicator would confirm that by showing a lack of sustained momentum.
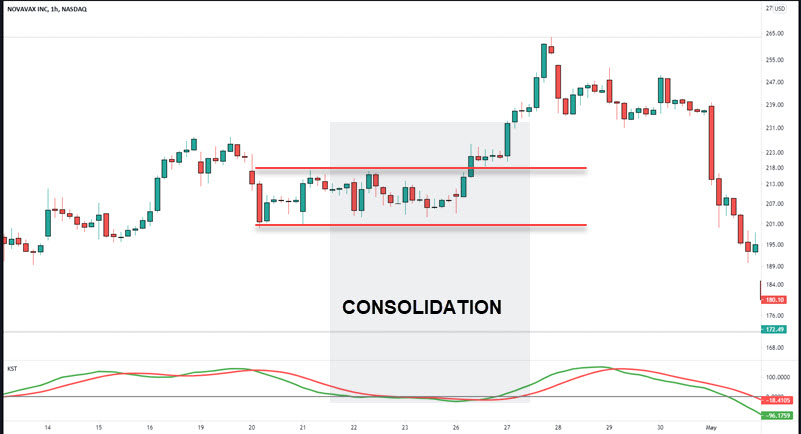
You know that eventually price will break out of this range and being a trending move. Ensure you have a range trading strategy in your toolbox to take advantage of not only the range, but also the pending breakout of price.
This feature of the indicator is also a good warning sign that the market conditions have changed. In that case, you may want to seek out another instrument that is actually moving.
Divergence Trading
When speaking of divergence, we are considering the direction of the indicator and the direction of price.
We want to see each going in a separate direction or not confirming each other.
What does that mean?
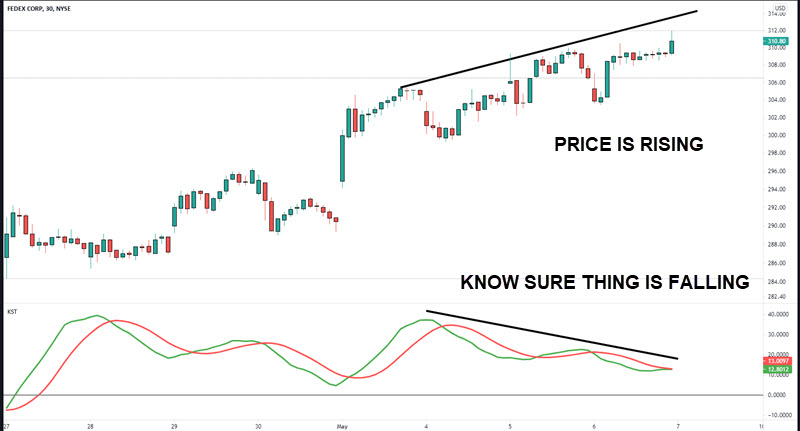
You can see the indicator is above the zero line so it is a bullish environment and you’d look for long positions.
What you can also see is that while price is rising, the momentum indicator is falling. This means that higher prices could be in danger.
It can also give you, as you see in the graphic, pretty tough price action trading conditions when momentum is falling. Choppy markets are no fun to trade.

Divergence works both ways as you see new lows put in with price but a higher low with the indicator. This points to the potential of higher prices, not the certainty.
Trend Line Breaks
One of the top uses of the Know Sure Thing is using trend lines on the indicator itself.
This is a five minute stock chart so you’d be looking to make some quick plays on these breaks.

The vertical lines are showing where the indicator breaks the trend line and the arrows show the anticipated price move.
Traders will have different techniques to enter trades but all of these, on a simple breakout of the previous candle high/low, did give some room to advance your stop.
Conclusion
It’s a momentum oscillator that has the same use as any other one you’d find on your charting software.
Some traders may find having 4 different Rate Of Change periods being used with the Know Sure Thing, to be an advantage.
Trading crossovers of the zero line or the indicator lines should be done with other supporting information:
- Trend direction using price action
- Moving average for trend direction
- Bull flags and bear flags
- Range breakouts
- Other price action techniques
I do find that noting momentum in a trade, while maybe not giving big wins consistently, does give me ample opportunity to reduce risk in the trade.
For me, risk is everything and being able to have an objective view of an instrument that is breaking down, is always a good thing.