
- October 31, 2026
- Posted by: Shane Daly
- Category: Trading Article

You’ve built a trading strategy, tested it over 50 trades, and the results look promising. But is that enough evidence to trust the strategy?
There is no universal minimum number of trades that makes a backtest reliable. Thirty, 50, or even 100 trades can provide useful information, but none automatically proves that a strategy has a profitable edge. The answer depends on what you’re measuring, how much trade outcomes vary, and whether the results represent the conditions you expect to trade.
The real question isn’t simply how many trades you’ve tested. It’s whether those trades provide enough reliable evidence to support your next decision.
What You Need to Know Before Trusting a Backtest
- There is no universal minimum trade count. Thirty, 50, and 100 trades are useful checkpoints, not thresholds that validate a strategy.
- More trades can improve precision, but sample quality matters. Consistent rules, representative market conditions, and the distribution of outcomes affect how much you can trust the results.
- A promising win rate does not establish profitability. Average wins, average losses, trading costs, and expectancy determine the economic significance of the results.
- A large backtest can still be misleading. Overfitting, unrealistic execution assumptions, and hindsight-based decisions can distort historical performance.
- Historical success requires independent validation. Promising results may justify out-of-sample or forward testing, but they do not guarantee a persistent trading edge.
How Many Trades Do You Need to Backtest a Strategy?
The number of trades needed to backtest a trading strategy depends on what you’re trying to establish. Estimating how often a setup wins is different from determining whether the strategy has positive expectancy or whether a particular trading rule improves performance.
The amount of evidence you need also depends on how consistent the trade outcomes are and how precisely you need to estimate the results. A strategy with widely varying wins and losses may require substantially more observations than one with relatively consistent outcomes.
Rather than selecting a trade count in advance and assuming the strategy is validated when you reach it, consider what each sample size can reasonably tell you.
Are 30, 50, or 100 Trades Enough?
Thirty trades can provide an initial look at how a strategy behaves. You may identify problems with entry rules, trade management, or execution assumptions, but the sample is generally too limited to establish a modest trading edge with much precision.
Fifty trades provide additional information, although a relatively small number of unusual winners or losers can still have a substantial effect on the results.
At 100 trades, estimates of win rate and average performance may become more informative. However, even 100 trades cannot establish profitability with certainty, particularly when outcomes vary widely or the strategy depends on occasional large wins or losses.
Several hundred trades can improve the precision of performance estimates, provided the observations are collected using consistent rules and reasonably represent the strategy’s intended trading conditions.
| Trade Sample | What It Can Reveal | Main Limitation |
|---|---|---|
| 30 Trades | An initial view of strategy behavior and possible problems with trading rules or execution assumptions. | Generally provides limited precision for estimating a modest trading edge. |
| 50 Trades | Additional information about observed win rate, average outcomes, and early performance patterns. | A few unusual winners or losers can still materially influence the estimates. |
| 100 Trades | A more informative preliminary assessment of win rate and average trading performance. | Does not establish a persistent profitable edge or guarantee future results. |
| Several Hundred | Potentially more precise estimates when observations are sufficiently comparable and representative. | Rare outcomes, dependent trades, changing conditions, and testing bias can still undermine conclusions. |
These numbers are useful reference points, not statistical thresholds. The important question is whether the sample provides enough evidence for the conclusion you’re trying to draw.
Why Can a Small Sample Make a Strategy Look Profitable?
A small sample can make a trading strategy appear more successful than it really is because a short sequence of trades may not reflect its underlying performance. This is sampling variation: observed results fluctuate even when the strategy’s rules and underlying characteristics remain unchanged.
Suppose your strategy wins 14 of its first 20 trades, producing a 70% win rate. Over the next 80 trades, it wins 42. Your combined record is now 56 winners out of 100 trades, reducing the observed win rate to 56%.
Nothing about the strategy’s rules changed. The additional trades simply provided more information, changing your estimate of how often the strategy wins.
The uncertainty can remain substantial even after 100 trades. For example, when trades are independent and the underlying probability of winning is stable at 50%, the approximate 95% margin of error for the estimated win rate is 9.8 percentage points with 100 trades. At 400 trades, it decreases to approximately 4.9 percentage points.
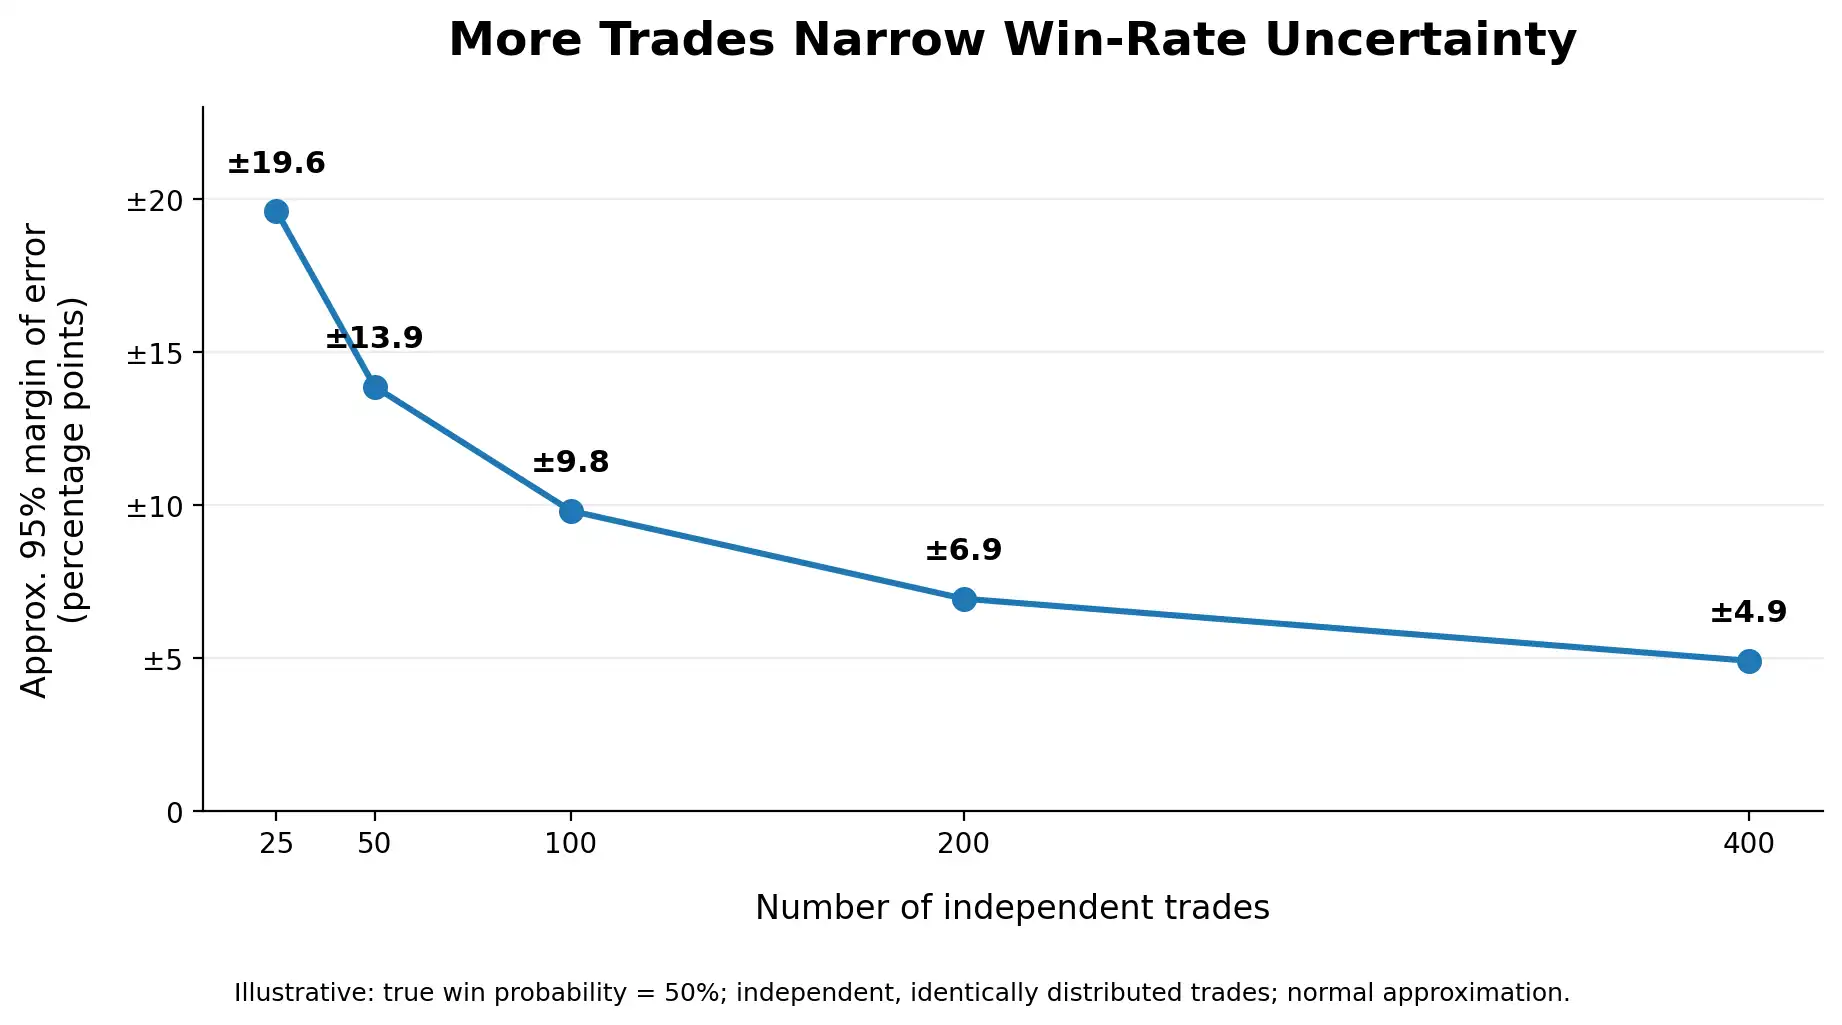
These calculations apply to estimating win probability, not profitability, and assume conditions that may not hold in actual trading.
The practical lesson is that a strong early win rate may reflect favorable sampling variation rather than a persistent advantage. Before treating it as evidence of a profitable strategy, you need enough observations to evaluate both the consistency and economic significance of the results.
What Trading Results Should You Measure Besides Win Rate?
Win rate tells you how frequently a strategy produces winning trades, but it doesn’t tell you how much money the strategy makes or loses. To evaluate performance, you also need to examine the size of winning and losing trades, trading costs, and the distribution of outcomes.
Average win and average loss help determine whether profitable trades generate enough returns to offset unsuccessful ones. Expectancy combines these results with win rate to estimate the average outcome per trade.
Profit factor compares total gross profits with total gross losses, while maximum drawdown shows the largest peak-to-trough decline observed during the test.
These measurements provide different perspectives on performance. None establishes that an observed historical advantage will persist, and their reliability still depends on the quality and quantity of the underlying trade data.
Why Does Average Win Versus Average Loss Matter?
A strategy can win more often than it loses and still fail to generate a profit. What matters is whether the gains from winning trades are large enough to offset the losses from unsuccessful ones.
Consider 100 hypothetical trades:
Of those trades, 60 are winners averaging +1R each, while 40 are losers averaging -1.5R each. Here, R represents the initial amount risked per trade.
The 60 winning trades generate +60R. The 40 losing trades produce -60R.
Despite a 60% win rate, the strategy finishes with a net result of 0R before trading costs. Its average expectancy is 0R per trade, and its profit factor is 1.0.
Once commissions, spreads, and slippage are included, the net result becomes negative.
This is why a high win rate alone cannot establish a profitable trading edge. You need to evaluate how frequently trades win, how much they gain or lose, and what remains after trading costs.
Even then, the results are estimates based on the trades observed. A strategy with widely varying outcomes may require substantially more evidence before its average performance can be estimated with useful precision.
Why Do Some Trading Strategies Need More Trades to Test?
Two trading strategies can have the same number of recorded trades but provide very different levels of confidence in their estimated performance. The difference often comes down to how widely trade outcomes vary and whether profitability depends on a small number of unusual results.
Consider two hypothetical strategies, each tested over 100 trades, with results measured in units of initial risk (R) and excluding trading costs.
Strategy A produces 60 winning trades averaging +1R and 40 losing trades averaging -1R. Its net result is +20R, giving it an average return of +0.20R per trade.
| Measurement | Strategy A | Strategy B |
|---|---|---|
| Total Trades | 100 | 100 |
| Winning Trades | 60 | 5 |
| Losing Trades | 40 | 95 |
| Average Winner | +1R | +25R |
| Average Loser | -1R | -1R |
| Net Result | +20R | +30R |
| Average Return per Trade | +0.20R | +0.30R |
Strategy B produces 95 losing trades averaging -1R and five winning trades averaging +25R. Its net result is +30R, giving it a higher average return of +0.30R per trade.
To see how sensitive Strategy B’s results are to those exceptional winners, consider what would happen if two of its +25R winners had instead been typical -1R losses. Its net result would fall from +30R to -22R.
This does not mean those winners should be excluded. It demonstrates how sensitive the strategy’s estimated performance is to a small number of outcomes. More observations may be needed to determine how frequently those exceptional winners occur and whether their contribution is reasonably represented in the sample.
The same problem can occur with rare, unusually large losses. A strategy may appear consistently profitable until a loss that occurs infrequently—but materially affects long-term performance—appears in the results.
Trade dependence introduces another complication. Several trades triggered by the same market event may respond to the same underlying conditions, providing less independent information than an equal number of unrelated trading opportunities.
The practical implication is that strategies with highly variable outcomes, rare but significant gains or losses, or strongly related trades may require considerably more evidence to estimate performance with useful precision. Trading frequency alone does not determine how many trades are enough.
Should You Test a Strategy Across Different Market Conditions?
A trading strategy doesn’t need to perform well in every market environment, but its backtest should reflect the conditions in which you intend to use it. Changes in trend strength, volatility, liquidity, and price behavior can affect how a strategy performs.
Consider a trend-following strategy tested primarily during a prolonged period of strong directional movement. Its historical results may look attractive because the market consistently provided the conditions the strategy was designed to exploit.
That doesn’t necessarily mean the strategy is unreliable. However, those results provide limited evidence about how it would behave during extended consolidations or periods of choppy price movement.
If your trading rules allow you to avoid those environments, the backtest should evaluate how consistently those conditions can be identified before a trade is taken. A filter that appears effective only after reviewing historical outcomes is not reliable evidence that the same trades could have been avoided in real time.
Separating results by market condition can help identify where a strategy performs well or poorly. However, this also reduces the number of observations within each group.
For example, a backtest containing 120 trades might include 70 trades during trending conditions, 35 during ranging markets, and 15 during unusually volatile periods. Although the combined sample contains 120 trades, the results from the 15 high-volatility trades provide much less information about performance in that specific environment.
The goal isn’t to collect equal numbers of trades from every market condition. It’s to understand which conditions the strategy is intended to trade, whether those conditions can be identified consistently, and whether the available results adequately represent them.
A large overall sample can still leave important questions unanswered when most of its trades come from a narrow range of market environments.
Can a Large Backtest Still Give You Misleading Results?
Even a backtest containing hundreds or thousands of trades can produce misleading results if the testing process contains systematic errors. A larger sample may reduce ordinary sampling uncertainty, but it cannot correct mistakes in how trades were selected, simulated, or evaluated.
For example, look-ahead bias occurs when a historical test uses information that would not have been available when the trade decision was made. Survivorship bias can arise when a strategy is tested only on instruments that remained available, excluding those that disappeared or were delisted.
Execution assumptions can also distort performance. A backtest that assumes every order fills at the desired price may overstate profitability if it ignores spreads, commissions, slippage, or insufficient market liquidity.
These problems can make a strategy appear more profitable than it would have been under realistic trading conditions. Adding more trades to a flawed test does not eliminate the underlying bias.
One particularly important source of misleading results is repeatedly adjusting strategy rules until they fit the historical data exceptionally well.
How Do Rule Changes and Overfitting Distort Backtest Results?
Overfitting occurs when a strategy is adjusted to perform exceptionally well on historical data, including patterns that may reflect chance rather than a persistent market advantage.
Suppose you backtest a trading strategy using several stop-loss distances, profit targets, moving-average settings, and trading-session filters. After comparing dozens of combinations, you select the version with the highest historical profit.
That result may look convincing, particularly if the backtest contains hundreds of trades. However, the selected combination has benefited from being compared against many alternatives. Some of its apparent advantage may reflect random patterns specific to the historical period rather than a repeatable edge.
The problem becomes more pronounced when you repeatedly modify the rules after reviewing the results. Each adjustment uses information from the same historical sample, gradually turning that data into part of the strategy-development process.
Changing rules during a backtest also complicates interpretation. Results from different strategy versions should not automatically be combined and presented as though every trade followed one unchanged set of rules.
One way to evaluate whether an apparent improvement extends beyond the development data is to test the finalized strategy on a separate historical period that was not used to select or optimize its rules.
That independent test provides additional evidence about whether the strategy’s performance generalizes, although it cannot guarantee that the results will persist in future markets.
The important distinction is between finding a strategy configuration that performed well in the past and demonstrating that its apparent advantage survives evaluation on genuinely unused data.
How Do You Know When You Have Tested Enough Trades?
You’ve tested your strategy, collected the results, and calculated its performance. The remaining question is whether you have enough evidence to make the decision you’re considering.
Start by defining that decision. Are you trying to determine whether the strategy deserves further testing, estimate its average performance, or evaluate whether its apparent advantage is strong enough to justify a more demanding validation process?
These questions require different levels of confidence. A preliminary backtest may provide enough information to decide whether further investigation is worthwhile without providing sufficient evidence to conclude that the strategy has a persistent profitable edge.
The strength of your conclusion should reflect the quality of the test, the uncertainty surrounding its results, and the consequences of being wrong.
Rather than treating a particular trade count as the finish line, determine what your results actually support. A promising but uncertain outcome may justify additional testing, while a credible result that meets your predefined evaluation criteria may justify moving to independent validation.
Having enough trades doesn’t mean eliminating uncertainty. It means having evidence sufficiently informative for the specific decision you need to make.
When Should You Continue Testing Instead of Drawing a Conclusion?
Continue gathering evidence when the available results cannot support the conclusion you’re trying to draw.
For example, if your strategy’s apparent profitability depends on only a few unusually large winners, additional observations may help establish whether those outcomes occur often enough to support the estimated expectancy.
Further testing may also be appropriate when important trading conditions are poorly represented or when the uncertainty surrounding average performance remains too large for the decision you’re considering.
However, collecting more trades isn’t always the correct response.
If the backtest contains inconsistent rules, unrealistic execution assumptions, or trades selected using hindsight, the priority is to correct the testing process. Increasing the sample size without addressing those problems can reinforce a misleading conclusion.
There are therefore three practical outcomes when reviewing your evidence.
| Evidence Condition | What It Means | Next Step |
|---|---|---|
| Insufficient Evidence | Estimates remain uncertain, important market conditions are underrepresented, or results depend heavily on a few unusual trades. | Collect more suitable observations. |
| Flawed Test Design | Inconsistent rules, hindsight-based selection, or unrealistic execution assumptions make the results unreliable. | Correct the testing method before drawing conclusions. |
| Credible Historical Evidence | The test is methodologically sound, and its results are sufficiently informative to justify further investigation. | Freeze the strategy rules and proceed to independent validation. |
The decision should depend on what the evidence supports—not on reaching an arbitrary number of trades.
When Should You Move From Backtesting to Forward Testing?
A promising backtest is a reason to investigate a trading strategy further, not proof that it will perform profitably in live markets. Once the historical evidence is sufficiently credible to justify additional testing, the next step is to evaluate the strategy using observations that were not involved in developing its rules.
One approach is out-of-sample testing. This uses a separate historical period that was not examined when selecting or optimizing the strategy. If the finalized rules continue to produce acceptable results on that data, it provides additional evidence that the apparent advantage was not limited to the original development sample.
Forward testing goes a step further by observing how the strategy behaves as new market data arrive.
Paper trading allows you to evaluate signals, rule consistency, and trade management without risking capital. However, simulated executions may not accurately reproduce slippage, partial fills, market impact, or the challenges of making decisions with real money at risk.
Limited-risk live testing can provide additional information about actual execution conditions, but it introduces financial risk and does not eliminate uncertainty about future performance.
Before beginning either form of forward testing, establish clear strategy rules, evaluation criteria, and risk limits. Avoid changing the rules simply because the first few results are disappointing or unusually strong. Otherwise, it becomes difficult to determine whether the original strategy is performing as expected.
The objective is to determine whether a promising historical result survives independent evaluation under realistic conditions. No particular number of backtested trades guarantees that outcome.
The Trade Count Is Only the Starting Point
Backtesting is not about reaching a predetermined number of trades. It’s about collecting evidence that helps you evaluate a strategy without drawing conclusions the results cannot support.
A promising sample may justify further testing, while a more substantial and representative record can improve your confidence in the estimates. Neither guarantees future profitability.
Before relying on your results, make sure the strategy was tested consistently, its performance accounts for trading costs, and the remaining uncertainty is appropriate for the decision you’re considering.
The strongest backtest isn’t necessarily the one with the most trades. It’s the one that provides credible evidence for what you need to decide next.
