- March 7, 2022
- Posted by: Shane Daly
- Category: Trading Article
I have always felt there is little benefit, from a learning perspective, with showing trades that cruised to profit easily. You can do everything right and still have a trade that doesn’t work out. This is why risk management is vital to any long term success.
I want to show you a trade that didn’t do as expected even when things are lining up. Does it make it a bad trade? No trade is bad if you follow a plan for the trade.
It’s when you go off on a different path than your trading plan allows.
Trade Setup – Trade Entry – Trade Management
Taking a look at a recent trade I had in HOG off the daily chart, we are going to cover all the essential factors that made up the trade.
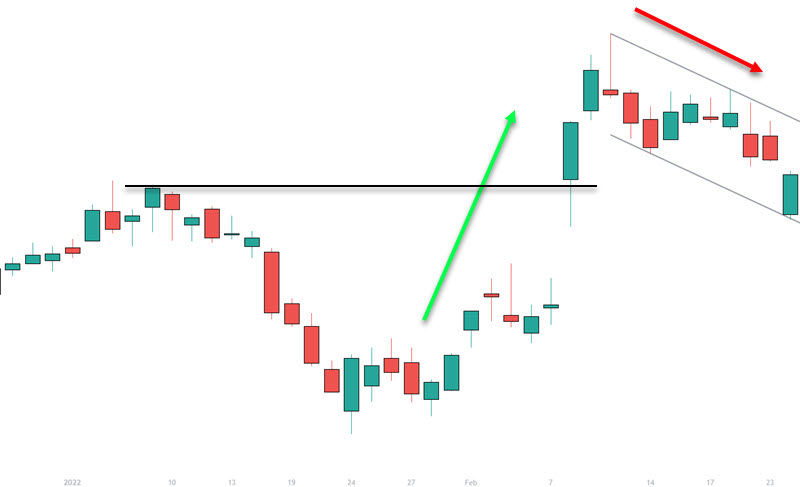
Big Price Move
On positive earnings, HOG shot up with a gap while breaking resistance. After a big move, we will often see price do a few things:
+ Form some type of consolidation pattern
+ Quickly reverse the move
There are variations of how those can play out but the bottom line is, we expect something to happen.
Your question now should be: “What is a big move?”.
You can use a technical indicator to measure momentum and then look for a big move in relation to previous moves in the indicator. You can also look at the chart and ask yourself if the current move is different than the recent past. Traders wanting an objective measure should stick with a momentum indicator until they can train their eyes to see the difference between a big move, and a normal one.
Consolidation or Pullback
While you can jump into a momentum move, we can never know if we are doing so at the peak of the move. Waiting for even a one day price pause and then playing a breakout can have better odds than just hitting the buy button.
In this case, we started seeing a bull flag formation or a triangle pattern. Both of those patterns start off the same with the main difference being the flag pattern will have a lower fourth swing. The triangle will show lower highs and higher lows.

Traders will generally play both these chart patterns the same way through a breakout of the upper line or some variation of that. You can also play a bounce off the lower line which may be a price zone of support. A knowledge of candlestick patterns can also come in handy when approaching this type of setup.
One of the keys with trading the flag pattern is we prefer to see a lack momentum during the corrective move. While we can still trade when momentum does occur in the decline, I would like to see a small consolidation before entering.
Recap: HOG made a large move to the upside and began to form some type of pattern that eventually turns into a bull flag. The bull flag in this setup is also a complex correction. The setup part of the trade is complete and now we must focus on how to enter the trade.
Trade Entry/Trigger
There are so many ways you can enter a trade. From the hook of a momentum indicator to a smaller time frame breakout, having a few you can use ensures you give yourself every opportunity to enter a trade. Be consistent with the few you use as this will avoid knee-jerk trade entries.
Before covering the trade entry that was used, let’s go over a few options for traders depending on their daily schedule. There are techniques for those who work during the day as well as those who can watch in the early part of the session. This will give you a few options you can test for yourself within the strategy you use.
Enter near the close
About an hour before market close, you can go through the tickers you are interested in to see their condition and what could be on your potential entry list. In the case of HOG, price had hit the bottom of the channel that made up the bull flag and was strong heading into the close. It’s not always a great entry as we have seen price turn to close on the lows in the last few minutes of the session.
But that is what our protective stop is for.

The shaded area on the daily candle is the price movement inside the last 30 minutes of the trading session. The candle was strong going into the close and ended up closing near the highs of the session. A trade entry inside the last 30 minutes with a protective stop loss at the lows, is a potential entry for you.
For a trader that has some time in the morning to look at the screen, we can look for an opening range breakout or other techniques for our entry on a lower time frame.
Lower Time Frame Entries
If price is trading near the potential reversal point on the session, traders may decide to keep that chart front and center for the trading day. You will need to define what that zone is for you. For one trader, it could be structure support or resistance zones. Another trader may use a Fibonacci level, a trend line, or the edges of a price pattern. It is a little more aggressive of an entry when using a lower time frame, but does get you in a little closer to the price where the reversal occurred.
Buying Breaks
This is the 30 minute chart and you can let the first 30 minutes pass by so you can read the price action. This day opened with a gap down and a strong 30 minute reversal. Placing a buy stop order for a break of the high of the 30 minute range and a stop loss at the low of the day, is a viable trade entry.

Once the entry and stop are set, traders can get on with the rest of the day and let the market work. You’ve limited your risk and some days you won’t get triggered as price puts in either a range or continues in the same direction.
Break Of Resistance
This entry can be set up near the close of the session or in the morning of the session. It’s a little hands off at first but gives you the opportunity to adjust your entry depending on the session.
In order for an uptrend to resume, we need to start seeing higher swing highs. On a lower time frame, you will see a downtrend structure of lower highs and lows. Your trade entry can go above a nearby price pivot because a break of that pivot, will be a new high.
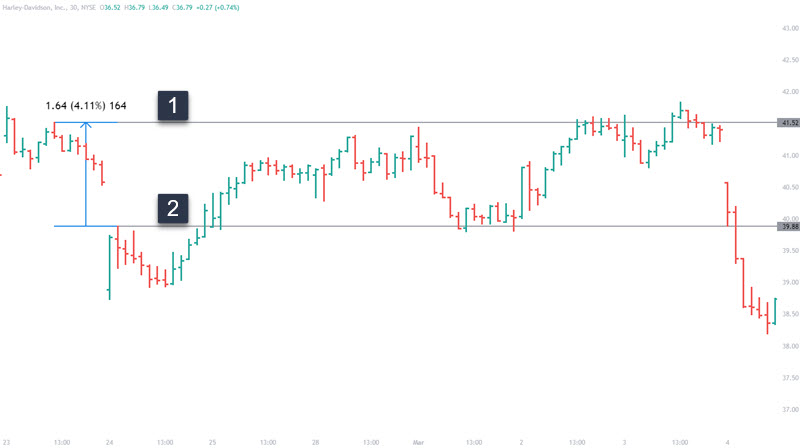
Whether you set it in the morning or the previous day near the close, the first pivot break would have been at the zone labeled #1. The gap down placed the entry a fair distance from the open which is a sign that we may have another pivot form in the morning.
At #2, the new pivot forms as price started putting in candle lower highs and lows. A trade entry trigger will be pricing putting in a higher high with a higher low which is our structure uptrend. The stop loss will go around the low of the session.
I generally use a 30 minute chart to set levels when setting up a swing trade or will enter near the close of the session. Rarely will I touch the market during the meat of the session when swing trading.
For this trade and mainly because of the gap down, I used the opening range breakout on the 30 minute chart with a protective stop a little under the low. The trade triggered and was under water quickly.
Trade Management And Profit Targets
With the markets in this current environment because of the war, I usually set tight targets of 1.2-1.5R with stop loss management. With this trade, my thought was I would see price at least test the second high in the pullback given positive earnings and a strong rejection of lows.
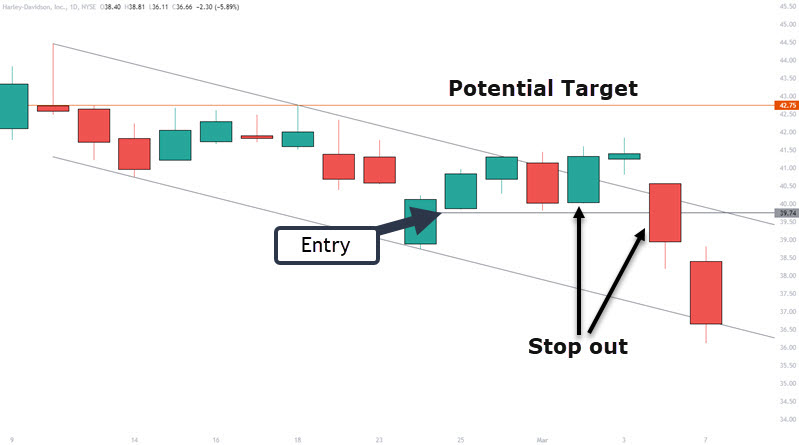
After two days of higher closes, the day ends red and my stop is adjusted to break even. The second day price puts a marginal new high and the stop loss goes under the green day. With a day of consolidation, the stop remains and is eventually taken out on the next day.
I would have been better taking the profit at an R multiple.
Are 1.5R trades profitable? Yes. Even 1R trades can work well over the long term. While many have had the 1:3 risk reward drilled into them, if you adjust stops when price is not advancing in your direction, rarely will you take a full position loss. In fact, you will have many many more 1R winners than you will the higher rewards.
There are a lot of trading truths that in fact, are suggestions.
Summary
Even the best looking trades can end with marginal or losing results. This trade had a lot of good qualities and in the end, was essentially a scratch. Price continued to drop an extra $5.00 at the time of this article.
Know your setups, your entries, your stops, and when you will exit for profits. Find a strategy that suits you and the time you have available to trade.
Further Resources
Hope this HOG trade walkthrough gave you some ideas for your own trading. You may find the following useful as well: