- May 3, 2023
- Posted by: Shane Daly
- Categories: Trading Article, Trading Indicators
The Elder Force Index is a technical analysis indicator that measures the strength of bulls and bears in the market. It is based on the concept that when the bulls are in control, the price tends to close above the midpoint of the daily range, and when the bears are in control, the price tends to close below the midpoint of the range. The Elder Force Index can be used to confirm trend changes and identify potential entry and exit points for traders.
What Is The Force Index Indicator?
The Force Index indicator is part of the family of oscillators that combines price and volume and helps to show turning points in the market.
This technical indicator was designed by Alexander Elder (sometimes called the Elder Force Index), to identify the force of the move and brings together three pieces of data: Direction of price change, how big a price move it was in that direction, volume that occurred during that change.
The Force Index has different smoothing settings for both short and long, for:
- Entry and exit points
- Confirm price trends
- Confirm important price reversals
The indicator can be used on any time frame that offers volume data as it is needed for the calculation. Forex traders, unless trading the futures contract, won’t get the full benefit of the indicator.
Force Index Formula
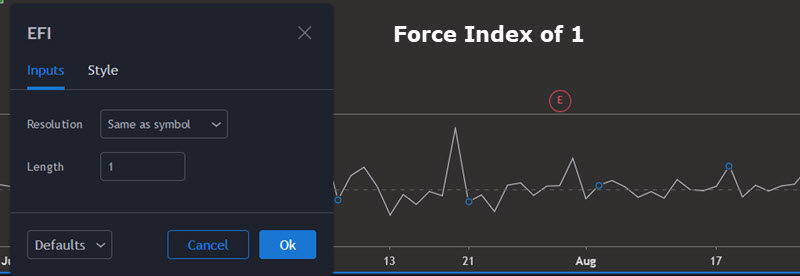
It is not a complicated formula compared to many indicators: Volume * (Close Today – Close Yesterday)
That will give you a jagged reading as the output is a Force Index reading of 1.
In this example, our setting of 13 means: a 13-period EMA (exponential moving average) of the 1-period Force Index values from the previous days.
Alexander Elder recommends this setting to reduce the positive-negative crossovers however he does use a 2-day-Force setting
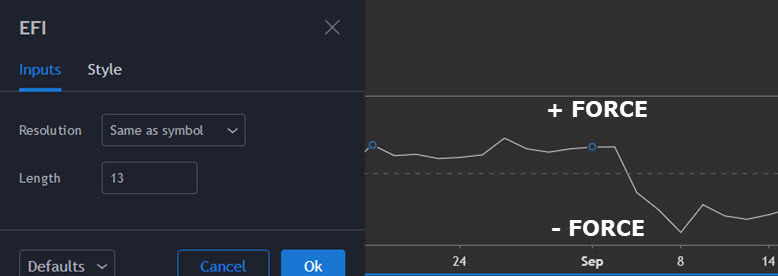
Check out the EFI line at various points in the window from the graphic.
If the closing price is higher than the previous close, it is a Force reading with a + sign. If it is lower, it is a Force reading with a negative sign.
If there is a strong downward trend with selling pressure, a low extreme reading will appear. In the case of strong buying pressure, you will see a high extreme reading.
Although the Force Index of 1 shows multiple crosses of the zero line, some traders believe that it gives too quick of a signal. To determine the appropriate settings, Elder suggests that traders test different settings based on their market approach.
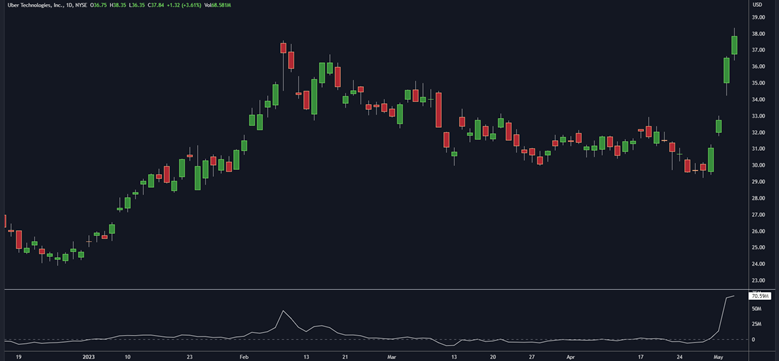
The indicator’s volume plays a vital role. You will see more significant moves with the Force Index when there are substantial increases in volume. In contrast, smaller moves will occur when there is low volume.
Pros and Cons of The Force Index
When it comes to trading indicators, there’s no such thing as a perfect one. The Elder Force Index is no exception. It’s important to note any potential limitations or drawbacks to using this indicator, so traders can make informed decisions about how to use it in their own trading.
| Pros | Cons |
|---|---|
| Useful for identifying strong trends | May provide false signals in choppy or consolidating markets |
| Helps traders confirm trend identification | Based on previous prices, may not be as effective in predicting future price movements |
| Can be used for entry and exit points in a trend | May not be the best indicator for identifying potential price reversals |
| Can be combined with other indicators for more comprehensive analysis | Like all trading indicators, it has its limitations and should not be relied on exclusively |
Despite these limitations, the Elder Force Index can still be a valuable tool for traders when used correctly. It’s important to understand its strengths and weaknesses and to incorporate them into a larger trading strategy that includes other indicators and analysis methods.
Time Frames And Settings
The EFI can be used on any timeframe, but the optimal settings and timeframes may vary depending on the trader’s preferences and trading style.
Short-term traders may prefer to use the EFI on a shorter timeframe, such as a 5-minute or 15-minute chart, to capture short-term trading opportunities. In this case, the optimal settings for the EFI may be a period of 13. These settings can help to filter out noise and provide a clearer signal of buying or selling pressure.
Longer-term traders may prefer to use the EFI on a daily or weekly chart to capture longer-term trends. In this case, the optimal settings for the EFI may be a period of 65. These settings can help to smooth out the indicator and provide a clearer signal of the overall trend.
Ultimately, the optimal settings and timeframes for the EFI will depend on the trader’s individual preferences and trading style. It is important to experiment with different settings and timeframes to find what works best for your own trading strategy.
How To Use The Elder Force Index In Your Trading
Since the Force indicator is designed to show buying or selling pressure in price movement, there are three specific ways we can use it.
3 Key Features of the Elder Force Index
Takes into account the difference between the prior close and current close. Did price close higher or lower than the previous day?
Measures the extent of the difference in price between the two closes and that will influence the indicator reading
Uses volume. Higher volume will show a commitment of either the buyers or sellers in that direction
Trend Identification/Confirmation of Trend
Since the Force Index shows the strength of the buyers and sellers, it can show, depending on the setting, the direction of the momentum price trend. Here is an example of a 13 period Force Index and and 90 day Force Index.
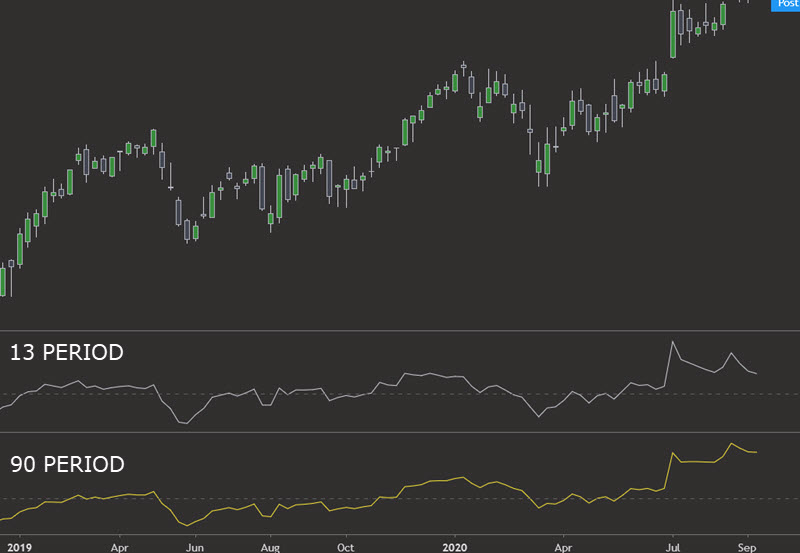
The differences may be subtle in some areas but looking at the ranges, you will see the 13 period crosses the zero line a bit earlier. This, depending how you trade with the overall trend, could get you in a trade while the market is in a range.
Once the EFI crosses the zero line, that could be a confirmation that the buyers or sellers are in control.
When reading the EFI, consider the direction the indicator is making :
| EFI Position | EFI Direction | Market Trend | Trading Strategy |
|---|---|---|---|
| Below Zero | Moving Downwards | Strong Bearish | No Buying Allowed |
| Below Zero | Moving Upwards | Tentative Long/ Potential Trend Change | Tightening Stops on Short Trades |
| Above Zero | Climbing | Strong Bullish | No Shorting Allowed |
| Above Zero | Falling | Tentative Short/ Potential Trend Change | Tightening Stops on Long Positions |
There are a few ways to interpret the indicator and the actions you could consider in certain states. Traders could also use a moving average such as the 50 period moving average on the price chart and use the EFI as trend confirmation.
Buying Pullbacks – Entry/Exit Indicator
The first step in using the indicator to buy or sell pullbacks is to determine the direction of the trend.
| Ways to Determine Trend Direction |
|---|
| Using a moving average on the price chart such as the 20 EMA, Elder suggested 22 period moving average, 50 EMA or longer |
| Price action forms structures of higher highs and lows and lower highs and lows. Use that to determine trend |
| Use a 13 period or longer Force Index |
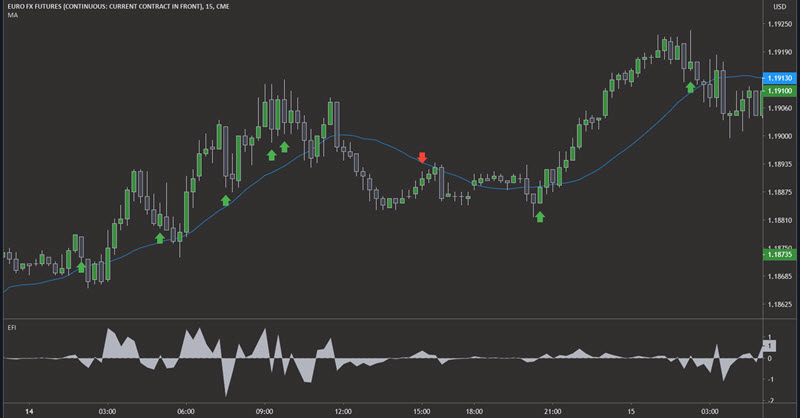
Trading corrections in the market is my favourite way to trade. Using a setting of 2 on the Force Index, will give you quick trade signals as the indicator is very sensitive to price changes.
| Trading Corrections Strategy |
|---|
| Trade only in the direction of your trend indicator |
| In an uptrend, look for the a buy signal which is the Force Index dropping below zero. Place a buy stop order above the bar (candlestick) that turned the indicator |
| Downtrends would look for the indicator to go above zero for a sell signal. You’d place an order to sell once the low of the bar (candlestick) is broken |
If price keeps falling or rising, continue to move your entry order until you are filled or the trend changes. Stop loss will go under the most current low (if long) and high (if short).
As an added confirmation, look for pullbacks to terminate around support or resistance levels.
Trading Force Index Divergence
If you’re using oscillators in your trading strategy, then trading a price divergence is likely already on your radar. And lucky for you, the EFI can help you do just that.
To give you a refresher, here’s what you need to know about trading divergence:
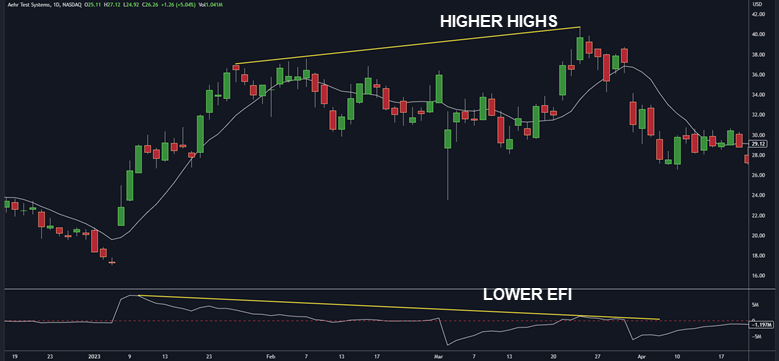
When the oscillator moves higher while price action heads lower, that’s called bullish divergence. But when the indicator moves lower and the price moves higher, that’s bearish divergence.
It’s important to keep in mind that divergence can happen at any point on the chart, so make sure you’ve got some type of confirmation that the trend is actually reversing. This could be anything from price action to a confirming indicator, or even a candlestick pattern.
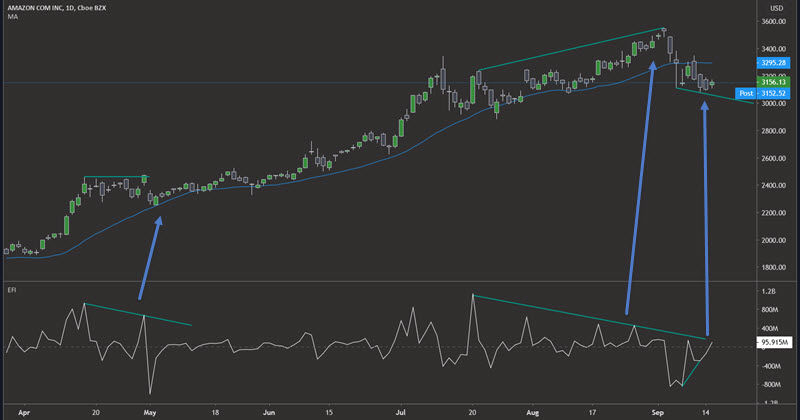
I have highlighted a few on this daily chart of Amazon but divergence will apply to day trading as well. The indicator in this example is set to 2 periods.
Starting from the left side of the price chart:
- Price makes a slightly higher high while the indicator has a bearish divergence. No big trend change but you can see price action was not too exciting to trade.
- Price continues it’s upwards advance yet the indicator heads down. We do see the bearish divergence worked
- As of this writing, we have a bullish divergence put in as price put in a lower low yet the indicator gave a higher low
A longer or shorter period for the indicator may give you different points of divergence or none at all. I have found that there are times even with different settings, the change in the shape of the indicator is very subtle.
You will need to find a trade trigger, and entry point, to enter divergence setups. The easiest method is to use a trend line break as the entry location.
Combine With Other Indicators
The Elder Force Index is a powerful tool that can be combined with other indicators to enhance trading decisions. When used in conjunction with other indicators, such as moving averages, MACD, or RSI, it can provide a more comprehensive picture of the stock’s current price movement. For example, if the Elder Force Index indicates a spike in buying pressure, but the stock is trading below its 50-day moving average, it may indicate a short-term increase in demand that is not sustainable.
 Another way to use the Elder Force Index is to look for divergences between the indicator and the stock price. If the stock is showing sideways movement, but the Elder Force Index is trending upwards, it may indicate that buying pressure is building. Conversely, if the stock is trending downwards, but the Elder Force Index is trending upwards, it may indicate that selling pressure is dissipating.
Overall, the Elder Force Index is a valuable tool for traders who want to confirm signals and improve their trading decisions. By combining it with other indicators, traders can gain a more comprehensive understanding of the stock’s current price movement and make more informed trading decisions.
Force Index – The Bottom Line
Using price data from the current period and prior period, along with volume, makes this indicator something to experiment with. We have a combination of trend direction through the closing of price and the intent of buyers and sellers through the use of volume.
It can be made sensitive with a period 2 setting which is great for entry and exit signals.
Longer period settings would be good for trend following methods of trading.
Include other forms of technical analysis such as price patterns or other trading indicators to complete a full trading strategy.
Updated May 2023
Published June 2020