- December 8, 2020
- Posted by: Shane Daly
- Category: Trading Article
Markets have their own version of “bait and switch” where you buy one thing, and it turns it out be something else.
In trading, we call in a bull trap (bear trap is the opposite).
Here is how it plays out:
- Market starts to breakout to higher prices over an obvious resistance level
- Traders not wanting to be left behind, buy into the stock, currency, or futures symbol
- Price flips to the downside and start to trigger stop losses for traders with tight stops
- Buyers holding on start to run for the exits
- Selling is fueled and traders who recognized the bull trap and began to sell, see quick profits.
Why does the bull trap happen?
Expectations.
Traders see their expectations of higher prices are not met, they sell out which causes the market to drop lower. Those that recognized the bull trap are already selling and having their position move quickly into profits from all the buyers unloading.
We can see bull traps after:
- Price has been in a range and starts to move out to the upside
- After a large move to the downside, price begins to move up and traps traders long when it heads back down
- Large momentum moves to the upside causing traders who fear missing out (FOMO) to jump in – and then forced out
For buyers still hanging on, they soon see their stop loss hit causing a further cascading of prices. Bull traps work at demoralizing traders, especially new traders, and can often result in traders looking to “get even” with the market.
Learning how to identify, avoid, and even profit from bull traps is what we are going to discuss.
How To Identify A Bull Trap
It is not always easy to separate a true move from a potential bull trap but there are some things, from a technical analysis perspective, that can help you minimize the chance of getting hit.
One thing I want you to remember, a bull trap is not a false breakout signal.
Why?
Did price break out?
Yes.
There is nothing false about that.
Did the break fail to continue?
Yes. When that happens, you go from breakout trading mode into pullback trading mode because price is actually pulling back.
Let’s take a look at common price moves that can result in bull traps.
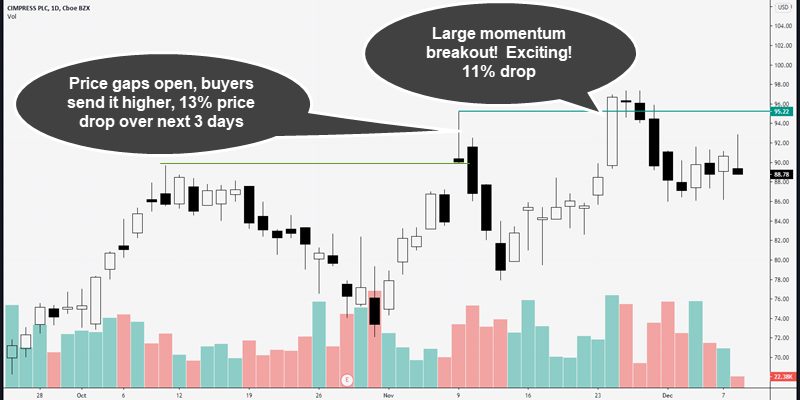
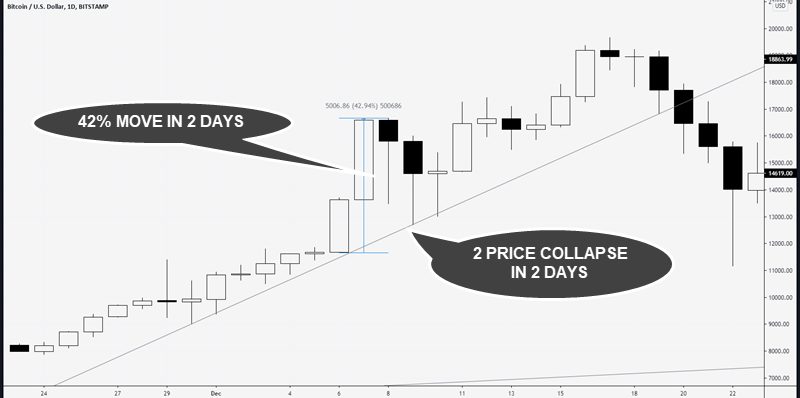
The first example is price gapping over a previous swing high. Buyers send it higher only to see it crash over the next several days. The size of the candles show trapped buyers hitting the exits hard over the next 2 days.
The second example excites many traders as they see momentum push over resistance. A slight pause is normal after a breakout but price has no intention of moving higher. Trap is sprung.
In these two daily time frame examples, what do you notice?
The moves appear to show strong upside price action and are enticing to trade. Imagine what they looked like on an intra-day time frame.
Also note that the breakout happened, rolled over, and then you get a pullback pattern you can trade.
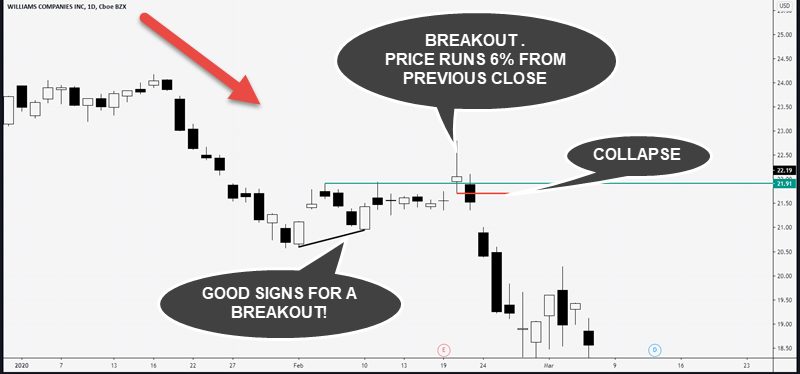
Sometimes the traps are not as obvious. Taking a look at this chart, we have a successful breakout.
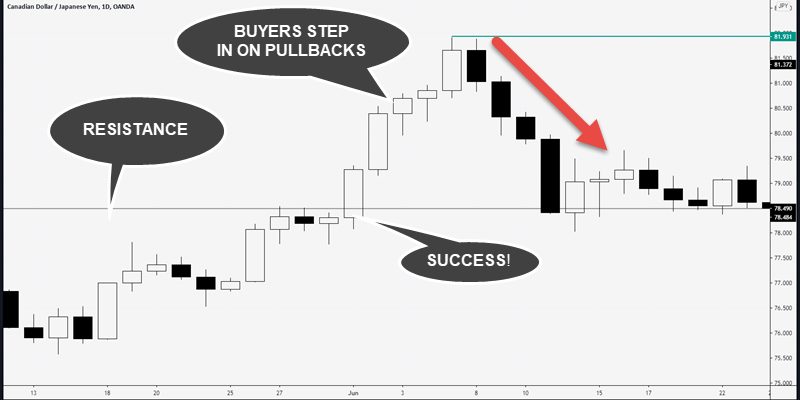
The day after the breakout, buying increases as more traders see a successful breakout and look to make big gains.
The next two days, we see pullbacks in price which gives late buyers a chance to enter. Traders that were in early, are already taking profits.
After those two days of pullbacks, those late to the party aren’t going to miss this move (so they think).
We get an inside day candlestick pattern and price begins to break down. Finally, at the end, traders who held on hoping for a reversal, get dealt an almost 2% drop in one day.
This is painful.
How To Avoid Getting Stuck In A Bull Trap
Not all traps can be avoided but you can be on the lookout for signs that one may come. Whether you are an active trader or an investor, you should have a trading plan that can help you stay away from these potentially costly price moves.
There are ways to do this through technical indicators, price action, and learning how to take profits when your expected price move, is under threat.
Avoid Trading Range Breakouts – Look For Accumulation
Breakouts from a trading range are where many of the traps take place. While I say avoid trading the breakout, there is a way to be involved in a trade before the break. This way, when the bull trap gets set, you are already in profit.
Look for accumulation under the resistance area instead of playing the actual breakout.
I’ve covered this price action strategy in my article about trading failed breakouts.
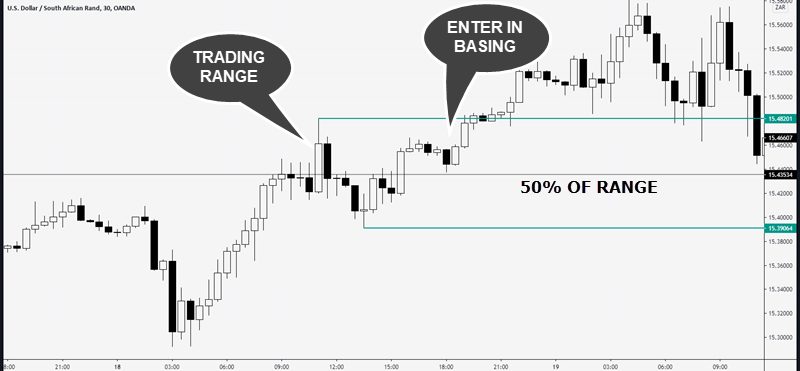
In this example, price is making higher highs and lows which is a structure uptrend. Price has began to base (go sideways) under resistance and in the upper 50% area of the range. You’d use your tools/techniques to find an entry – even mini trendlines that break can be your trigger.
Also be on alert for any break of highs that begins with momentum off the bottom of a range or retraced price.
By entering prior to the rush of trades on the breakout, you can at least pull out a tiny profit as price turns to knock out later buyers.
Stay Away From Big Moves
What this means is don’t just buy the highs of large price moves if you want to avoid getting trapped.
This does not mean that pullback trades are off-limits but even then, you can be bounced around like this chart shows.
This chart has been zoomed in but if you zoom out, the last several weeks made it appears as a straight line up. Those types of charts are just raring to fall back.
A technical analysis using indicators would have seen:
- RSI readings of maximum 94
- Price running along and above the Keltner Channel high line
- Price far away from both the 50 EMA and 100 EMA
Markets can stay overbought for a long time and while not using overbought as a reason to stay out/go short, it’s a heads up to watch for adverse price action. Tightening, scaling out, or just trailing your stop loss are good techniques.
How Can You Profit From Bull Traps?
The best way to profit from them is to first acknowledge that they happen.
Once you know they do, you can start to look for the potential of them when price movement resembles what we just discussed.
This example is one of my favorite plays.
Why?
It sets up in the context of a favorable price pattern – but price is in a downtrend:
- Price movement fails to put in a new low
- Buyers continue to buy even as resistance holds
- Price is basing under the resistance level
- Gap up and price runs 6% from previous close
How do we trade this?
The simplest approach to trading this is to put your sell order below the low of the candlestick that broke upwards above resistance.
You know you are wrong if price takes out the high and that’s where your stop would go.
What about this one?

Price has driven upwards from the bottom of a pullback which leads to a lower probability of a sustained breakout.
This is a 15 minute Forex chart and upon the breakout, some traders would have dropped to a 3-5 minute chart for an earlier entry to the first candle that closed below the resistance line.
Bull Trap Trading Strategy
Let’s wrap up with a simple trading strategy that can increase the probability of a successful trade using trapped traders.
I am going to use a crude oil futures day trading chart for this example but it can apply to any instrument.
First though, I want a condition that can lead to a bull trap.
You can look for:
- Price ranging and explosion of momentum from bottom of range
- Overbought condition using RSI or Keltner channels
- Strong momentum in price
Once I have that, then I can add some technical factors to it.
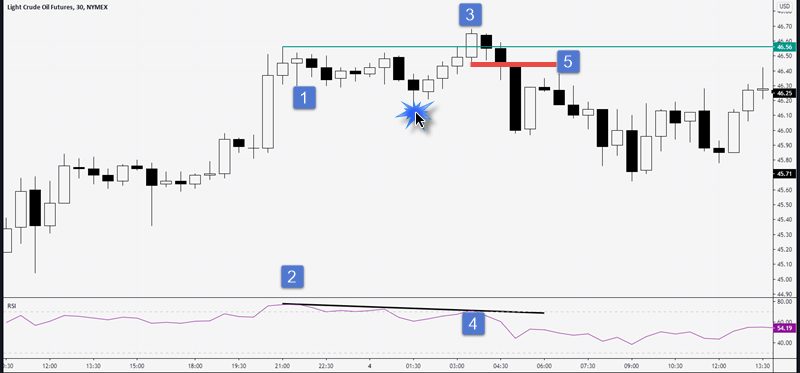
1 – We have momentum push into a tight trading range just under the highs.
2 – Using a 14 period Relative Strength Index, we are in overbought territory (by itself, this is not a signal to short)
The blue splash with the arrow is a legitimate signal to buy. Price broke lower than the initial range and was bought up. It fulfills the requirements to trade pre-breakout that we discussed.
3 – Price breaks out of the range and makes new highs. If using volume to show strength, this breakout had a higher volume reading than the momentum move at number one.
4. If using the RSI for divergence, price made new highs while the indicator is trending down
5 – This would be an entry short and if you were long out of the range, this could be your profitable exit. Short trades could use the price target of the bottom of the range or look to target base of momentum candlestick.
Stop loss location can be at the high of the reversal, an ATR setting, and stop loss can also be trailed using a moving average or highs of candlesticks.
Conclusion
Bull traps are a viable trading approach as price discovery is an absolute in trading.
These traps take advantage of traders fears of missing out and are powered by these traders hitting the exits which can be exploited by knowledgeable traders.
Yes, some breakouts just take off and go which is why knowing how to approach a breakout style of trading is important.
If you are trading the trap and price reverses against you, you may not have to wait for your stop to get hit. Reading price action can help you get out earlier but it is vital to get out. If the breakout has a successful run, you don’t want to be holding on hoping for price to reverse in your favor.