- June 29, 2023
- Posted by: CoachShane
- Categories: Trading Article, Trading Tutorials

When selecting charts for swing trading, it’s important to consider the timeframe of the trades. Candlestick charts are popular for shorter-term trades, while Renko and Heikin Ashi charts may work better for longer-term trades. Ultimately, the best chart type will depend on the trader’s preferred timeframe and trading strategy.

Swing trading is an exciting way to invest in the stock market. It allows you to take advantage of short-term price swings and potentially make decent returns as you hold a position for an extended period of time.
Swing traders need to have a good understanding of technical analysis and chart reading skills to spot trends, patterns and trading setups that can help make decisions that may lead to winning trades.
In this article, we will discuss some of the best charts for swing trading. These charts are essential tools for swing traders as they provide valuable insights into price movements and can help identify potential entry and exit points.
Introduction To Swing Trading
Swing trading is a popular strategy that has gained traction among traders who have a full time job and are unable to day trade. It involves holding positions for several days or weeks, unlike day trading where trades are executed and closed within the same day.
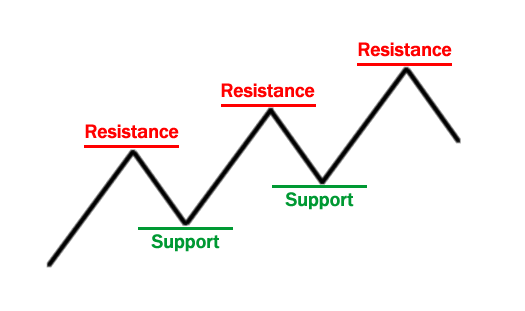
Successful swing trading requires an understanding of price action, technical analysis, and many times using indicators. Price action refers to analyzing the movement of prices in order to identify market conditions and potential setups.
By identifying support and resistance levels for example, traders can zero in on that price zone for potential setups to occur.
Technical analysis involves utilizing charts and other tools such as moving averages to analyze an instrument. Indicators for swing trading provide additional insights by measuring momentum, volatility, and trend strength.
Some excellent swing trading indicators include RSI (Relative Strength Index), MACD (Moving Average Convergence Divergence), and Fibonacci retracements.
My focus is trading one clean swing in the instrument and is not dependent on time. The swing could last a few days, weeks, or a few months.
Understanding Charts In Swing Trading
Charts are the heartbeat of swing trading. They provide technical traders with an indispensable tool for analyzing price movements and identifying potential trends.
In essence, charts help to paint a picture of what’s happening in the market at any given time.
One popular charting program used by many swing traders is TradingView. This platform offers a wide range of features that make it easy to create custom charts depending on the needs of the trader.
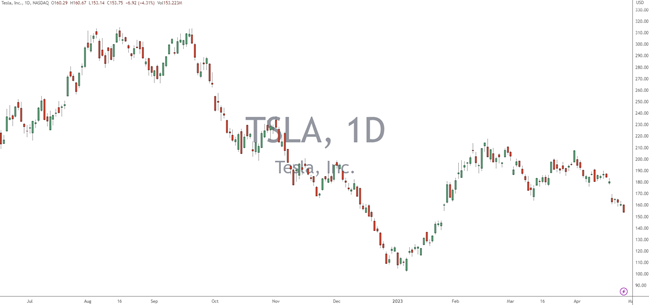
Weekly charts are also useful for swing traders as they allow them to take a step back and observe the bigger picture. By using these, traders can identify long-term trends and use this information if it is part of their overall approach.
As we cover the charts, remember there is no best timeframe for swing trading. Market participants all have their own needs.
The Daily Chart For Swing Trading
The daily timeframe is one of the most popular time frames for swing traders as it allows traders to take advantage of the trend while spending limited time at their screens. In this time frame, each candlestick represents one day of trading activity.
One important aspect of using the daily chart for swing trading is identifying key price levels. These are areas where the price has previously shown support or resistance and may do so again in the future.
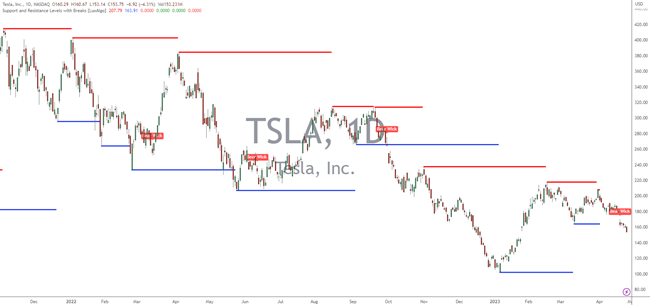
Traders can use these levels to enter or exit trades, set stop losses or take profit targets.
It’s also important to use an indicator for swing traders such as moving averages or RSI to confirm any potential trade setups. By analyzing the daily chart and combining it with other technical analysis tools, traders can often make better trading decisions due to their understanding of current conditions.
The Weekly Chart For Swing Trading
Did you know that the weekly timeframe is tied in importance for swing traders as the daily chart.
This makes sense because swing trading involves holding positions for several days or weeks, and the weekly chart provides a big-picture view of market trends.
The weekly chart is also useful for charting the trading activity over longer periods of time. It allows traders to see how prices have moved over multiple weeks and identify key levels of support and resistance. A rule of thumb is the longer a support/resistance level is in place, the stronger it can be when price returns.
One big benefit is it can help traders avoid getting caught up in short-term price fluctuations that happens on the lower charts. With only one closing price every 5 days, it is impossible to overtrade.
When using the weekly chart for swing trading, it’s important to keep in mind that patience is key. Since this timeframe covers a longer period of time than shorter charts like daily or hourly, there will be less frequent trade opportunities.
However, when trades do occur, they tend to have more significant potential profits due to the larger timeframe being analyzed.
The 4-Hourly Chart For Swing Trading
Moving on from the weekly chart, the next frame for swing trading that we will explore is the 4-hourly chart. This timeframe can be particularly useful for traders who prefer to hold positions for a few days up to a week depending on the trend.
Some excellent swing trading indicators that work well with the 4-hourly charts include moving averages, Bollinger Bands, and Stochastic Oscillators. These are great tools that help traders analyze price movements and make educated decisions about their trades.
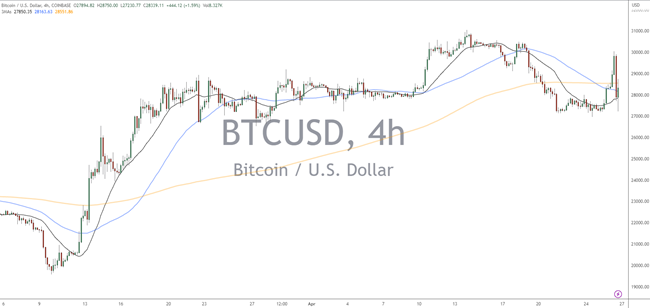
Trading platforms like MetaTrader (popular for Forex traders) offer these indicators among others, making it easier for traders to access all they need in one place.
Hourly chart swing traders usually have a higher risk tolerance than those who trade on longer timeframes. They often take advantage of short-term fluctuations in prices by opening and closing positions quickly.
The key takeaway here is that while hourly charts provide more opportunities for profit, they also come with increased volatility, which means there’s a greater likelihood of losses if you don’t manage your risks.
It’s important to keep in mind that each timeframe comes with its unique set of benefits and drawbacks. Understanding how different timeframes work and the speed of price moves on those charts, can help you choose the right approach based on your goals and risk appetite.
30-Minute Chart For Swing Trading
Swing trading requires a trader to be able to identify short-term trends and patterns. To find these trends, traders use various tools like trading charts, chart patterns, and momentum indicators.
Another popular trading charts used by swing traders is the 30-minute chart. The 30-minute chart provides enough detail to capture intraday price action while still giving traders enough time to analyze the trend.
At this level, we are getting into the area of day traders but if you latch onto strong trends, you will end up carrying the trade for a few days.
When using this chart, it’s important to look out for key support and resistance levels as they can often act as turning points in the market. Additionally, with the help of indicators such as MACD or RSI, traders can get a better handle on price.
Keep in mind that there are two types of markets: trending and sideways.
When price is trending, you’ll see clear directional movement on the chart. In a sideways condition, prices will move within a range. By understanding which type of condition you’re dealing with, you’ll be putting the odds on your side.
The 15-Minute Chart For Swing Trading
As mentioned in the previous section, using a 30-minute chart for swing trading can be effective.
However, there are times when traders need to make quicker decisions and that’s where the 15-minute chart comes into play.
For instance, let’s say a trader is monitoring a stock that has been showing some volatility recently. After analyzing the charts on different time frames, they notice that the stock tends to form strong setups on the 15-minute chart.
By using this particular charting timeframe, the trader will have more opportunities to enter positions at optimal entry points.
When it comes to swing trading with a 15-minute chart, it’s important to remember that not all trades will work out as planned. Traders must still take precautions and use stop-loss orders to limit their losses if trade goes against them. The price trend on this chart will see move corrective action than the daily.
The best use for these short term time frames, for me, is to find an entry point when I see a set up on the daily chart.
Choosing The Right Chart
The type of chart you use can greatly impact your success as a swing trader. There are several charts to choose from, but not all of them will be effective for every trader.
It’s important to understand what kind of information you’re looking for in a chart.
- Are you interested in short-term trends or long-term trends?
- Do you need real-time data?
- Do you need the ability to design custom indicators?
Answering these questions will help narrow down which charts will work best for your specific strategy.
Once you have a better understanding of what you need from a chart, consider the different charts available: line charts, bar charts, candlestick charts, Heikin-Ashi and more. Each has its own unique benefits and drawbacks.
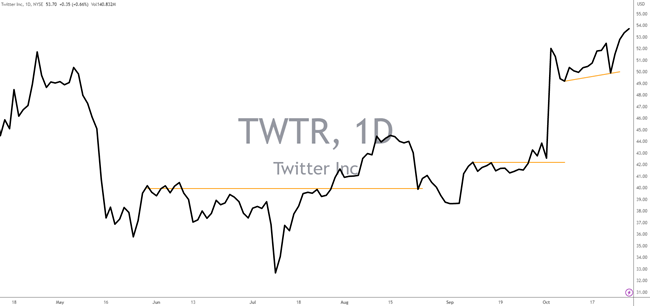
For example, line charts are useful for showing overall trends while candlestick charts provide more detailed information about price movements. Ultimately, the right chart for your swing trading strategy will depend on your individual needs and preferences.
For the most part, bar charts and candlesticks charts will be the only ones you need.
Technical Analysis Tools For Swing Trading
As a swing trader, it is important to have the right technical analysis tools in your arsenal. These tools will help you objectively look at price to determine if a trade exists.
But before we dive into specific tools, let’s take a step back and look at the frames for analysis. There are three main frames for analysis: daily, weekly, and monthly.
The daily frame provides short-term signals while the weekly and monthly frames provide longer-term signals. It is recommended that traders use multiple time-frames for analysis to get a comprehensive view of the state of the instrument.
Most trading platforms will have many indicators to choose from.
| Technical Indicator | Description |
|---|---|
| Moving Averages | Calculates the average price of an instrument over a specified period of time, and is used to identify trends and potential entry/exit points, |
| MACD (Moving Average Convergence Divergence) | A trend-following momentum indicator that shows the relationship between two moving averages of an instrument’s price, |
| RSI (Relative Strength Index) | Momentum oscillator that measures the strength and speed of an instrument’s price movement, and is used to identify overbought and oversold conditions, |
| Bollinger Bands | A technical analysis tool that uses a moving average with two trading bands above and below it, and is used to measure volatility and potential entry/exit points, |
| Fibonacci Retracement Levels | A technical analysis tool that uses horizontal lines to indicate areas of support or resistance at the key Fibonacci levels before the price continues in the original direction, |
| Automatic Potential Support and Resistance Levels | Automatic potential support and resistance levels are those areas on a price chart where the price has reversed from its upward or downward movement in the past. |
Swing traders can improve their decision-making process for entering or exiting trades by utilizing multiple time frames for analysis. This is an excellent choice for those who want a little more confirmation when they trade.
Moving Averages In Swing Trading
Moving averages are an essential tool for many swing traders as they do a great job in identify trends and even momentum if you know how to read them.
These indicators are calculated by averaging the price of a security over a specified period, which can range from days to months depending on the trader’s preference.
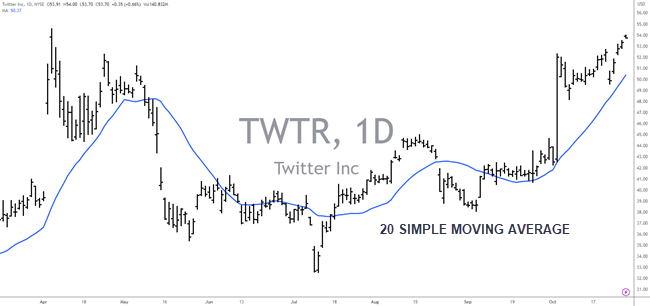
Moving averages work best when used in combination with other tools.
Swing traders commonly use two types of moving averages: simple moving average (SMA) and exponential moving average (EMA). SMAs provide a straightforward calculation of the mean price over a set number of periods.
On the other hand, EMAs give more weight to recent prices, making them better suited for short-term trading strategies.
Both SMA and EMA have their advantages and disadvantages, so it is recommended that you experiment with both before deciding on what works best for your trading style.
Other Indicators For Swing Trading
Some traders may believe that using charting and momentum indicators alone are enough to execute profitable swing trading strategies. However, incorporating additional indicators can provide valuable insight into patterns and potential price movements.
One such indicator is the Relative Strength Index (RSI), which measures the strength of a security’s recent gains versus its recent losses. This can help identify overbought or oversold conditions and potentially signal a reversal in trend.
Another useful indicator for swing traders is the Moving Average Convergence Divergence (MACD) oscillator, which helps identify changes in momentum by measuring the difference between two exponential moving averages.
In addition to these indicators, paying attention to key support and resistance price levels can also help in identifying potential entry and exit points.
By combining multiple indicators with an understanding of market structure, traders can increase their success rate when executing swing trading strategies.
Common Mistakes In Swing Trading
When it comes to swing trading, there are a few common mistakes that traders tend to make. Being aware of these pitfalls can help you better navigate the market and improve your chances of success.
One mistake is not having access to a solid trading platforms with good charting. Without reliable data and tools, it’s difficult to make decisions about when to buy or sell. Ensuring you have access to accurate and up-to-date trading charts is crucial for any successful swing trading strategy.
Another aspect that many traders struggle with is understanding basic market structure. It’s important to know how the market works and what factors influence price movements in order to develop an effective strategy.
This includes things like key support and resistance levels, trends, and technical indicators.
To avoid making common mistakes in swing trading, keep the following tips in mind:
- Always use reliable charting software.
- Understand the basics behind how price moves
- Be patient – don’t rush into trades without a trading plan
- Don’t let emotions guide your decision-making process.
By keeping these aspects in mind and avoiding common missteps, you’ll be better equipped for success in your swing trading endeavors.
Frequently Asked Questions
How Much Money Do I Need To Start Swing Trading?
The amount of money needed to start swing trading varies based on individual trading goals and risk tolerance. In general, traders should have at least $5,000 to $10,000 in trading capital to effectively participate in swing trading strategies. Beginners are advised to start with a smaller amount and gradually increase as they gain experience and confidence in their trading strategy.
What Is The Best Time Of Day To Execute Swing Trades?
The best time of day to execute swing trades depends on the market you are trading and the strategy you are using. Generally, it is recommended to trade during the hours when the market is most active and volatile, which tend to be the first and last hours of the trading day.
How Do I Determine When To Exit A Swing Trade?
Exiting a swing trade depends on various factors, including your strategy, risk tolerance, and market conditions. One common approach is to set a stop-loss order at a predetermined level to limit potential losses. Another strategy is to use technical indicators, such as moving averages or trend lines, to identify potential exit points based on price movements. Ultimately, the decision to exit a swing trade should be based on a trader’s analysis of market conditions and risk management goals.
What Are Some Alternative Charting Tools To Consider For Swing Trading?
Some alternative charting tools to consider for swing trading include TradingView, StockCharts, and TC2000. These platforms offer various charting features and technical indicators that can help traders analyze market trends and make informed decisions. They also provide access to real-time market data and historical price information for stocks, ETFs, and other financial instruments.
Conclusion
Swing trading can be a highly profitable approach, but it requires a good understanding of technical analysis, risk management, and market timing. While there is no set amount of money required to start swing trading, it’s important to have enough capital to cover potential losses and to not invest more than you can afford to lose.
In addition to traditional candlestick charts, swing traders may also consider alternative charting tools like Renko or Heikin Ashi charts. These can provide a different perspective on price movements and help traders identify trends and potential trade setups.
By keeping a close eye on these factors and using sound technical analysis, swing traders can make informed decisions and potentially achieve financial success.
Stop Guessing. Start Trading With Confidence!
Download the Free Trading Indicator Blueprint now to learn the truth about indicators,
Moving Averages, Keltner Channels, Stochastics, MACD and more.
Most people charge $97 for a course like this – but today you can get it free!
