
- September 4, 2026
- Posted by: Shane Daly
- Category: Trading Article

You enter a trade and price immediately moves against you. The setup still looks good, but the position is now carrying more heat than you expected.
How much adverse movement is normal?
There is no universal percentage, ATR multiple, or fraction of the stop that answers that question. A breakout, pullback, reversal, and mean-reversion setup can all behave differently after entry. Timeframe, volatility, entry method, and market structure also change how much movement against the position may be normal.
That makes the final trade result a poor guide by itself. A winning trade may have experienced substantial adverse movement before recovering, while another may have moved in your favor almost immediately. Losing trades can show equally important differences.
Maximum Adverse Excursion (MAE) and Maximum Favorable Excursion (MFE) give you a way to measure those paths. Used across comparable trades, they can help reveal whether your entries, stops, targets, and exits deserve closer examination.
The goal is not to find a magic MAE number. It is to determine what your trades normally do, whether the pattern is meaningful, and whether the evidence is strong enough to justify testing a strategy change.
MAE and MFE at a Glance
- There is no universal amount of adverse movement that defines a healthy trade. Normal excursion depends on the setup, timeframe, volatility, entry method, and structural logic.
- MAE measures the greatest movement against the trade while it is open; MFE measures the greatest movement in its favor.
- R-multiples, percentages, and volatility-based measures such as ATR can provide different forms of context. The same measurement method should be used consistently within a comparison.
- Compare MAE/MFE within similar setups and market conditions rather than combining unrelated trades into one dataset.
- MAE can raise questions about entry timing and stop placement; MFE can raise questions about target realism and exit behavior. Neither metric determines the correct rule by itself.
- Compare winners and losers, examine distributions rather than single averages, and look for patterns that persist across enough comparable trades to deserve further testing.
- Treat excursion patterns as hypotheses. Change a trading rule only after testing whether the change improves the strategy as a whole.
Why There Is No Universal “Normal” Amount a Trade Should Move Against You
There is no fixed percentage, R-multiple, or ATR value that defines normal adverse movement across all trades.
What is normal depends on the logic of the setup. A breakout, pullback, reversal, and mean-reversion trade can each produce different excursion behavior because they enter under different conditions and rely on different forms of confirmation and invalidation.
Timeframe and volatility also matter. The same absolute move can represent routine fluctuation in one market or timeframe and unusually large adverse movement in another.
For that reason, MAE becomes useful only in context. The real question is not:
“How much adverse movement is acceptable?”
It is:
“How much adverse movement is typical for this specific setup under comparable conditions?”
That distinction prevents a trader from applying one excursion threshold to trades that behave differently by design.
What Is Maximum Adverse Excursion (MAE)?
Maximum Adverse Excursion, or MAE, is the greatest unrealized movement against a trade while the position remains open.
For a long trade, MAE is measured from the entry price to the lowest price reached before exit. For a short trade, it is measured from the entry price to the highest price reached.
MAE can be expressed in price, dollars, percentage terms, R-multiples, or volatility-adjusted units.
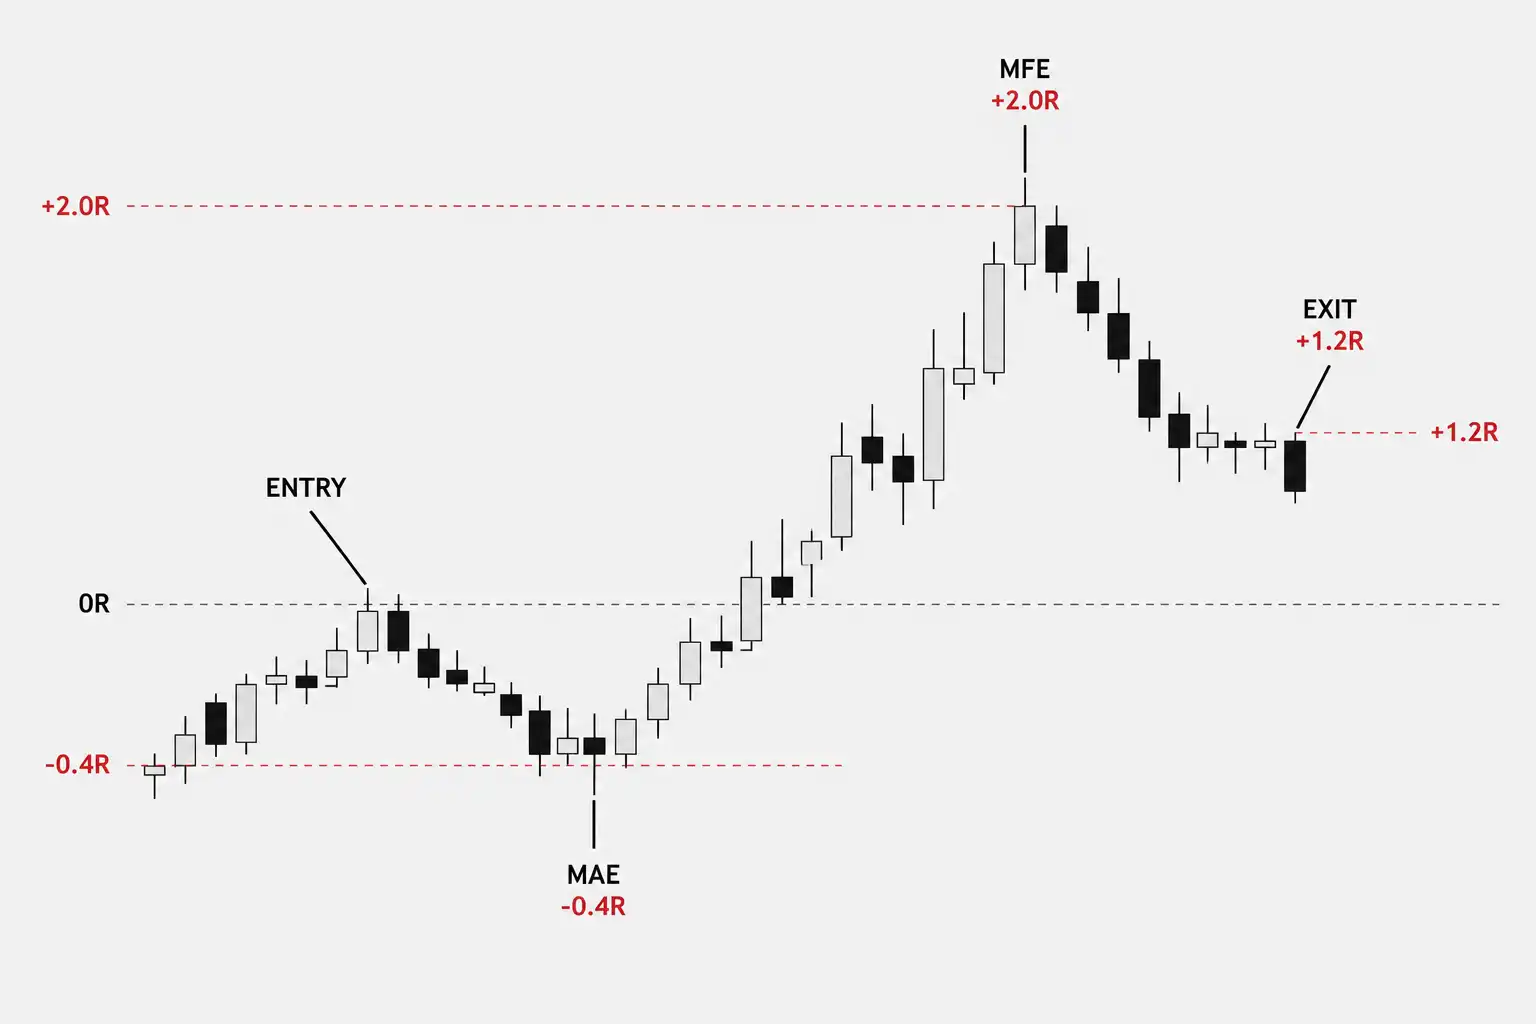
For example, if the initial stop is 1R from the entry and price moves 0.4R against the position before recovering, the trade has experienced an MAE of 0.4R.
MAE describes the path of the trade, not its quality. A winning trade can experience large MAE, while a losing trade may experience very little before failing.
Its value comes from showing how much adverse movement occurred between entry and exit—information that final profit or loss alone does not reveal.
What Is Maximum Favorable Excursion (MFE)?
Maximum Favorable Excursion, or MFE, is the greatest unrealized movement in a trade’s favor while the position remains open.
For a long trade, MFE is measured from the entry price to the highest price reached before exit. For a short trade, it is measured from the entry price to the lowest price reached.
Like MAE, MFE can be expressed in price, dollars, percentages, R-multiples, or volatility-adjusted units.
A trade might reach an MFE of +3R and later close near breakeven. That does not automatically indicate poor management. It just shows that the trade produced substantially more favorable movement than was ultimately realized.
MFE helps describe the opportunity that existed while the trade was open. Compared across similar trades, it can raise useful questions about target placement, exit behavior, and how much favorable movement a strategy tends to retain.
Those questions still require further analysis. MFE measures what happened; it does not determine what the trader should have done.
When Is Adverse Movement Still Consistent With the Trade Setup?
Movement against your entry does not automatically mean the trade is failing. The more useful question is whether price is still behaving within the conditions that justified the trade in the first place.
A trade can experience meaningful MAE and remain valid. It can also show relatively little adverse movement while the original setup begins to deteriorate. Distance from entry is therefore only one part of the evaluation.
Normal Adverse Movement
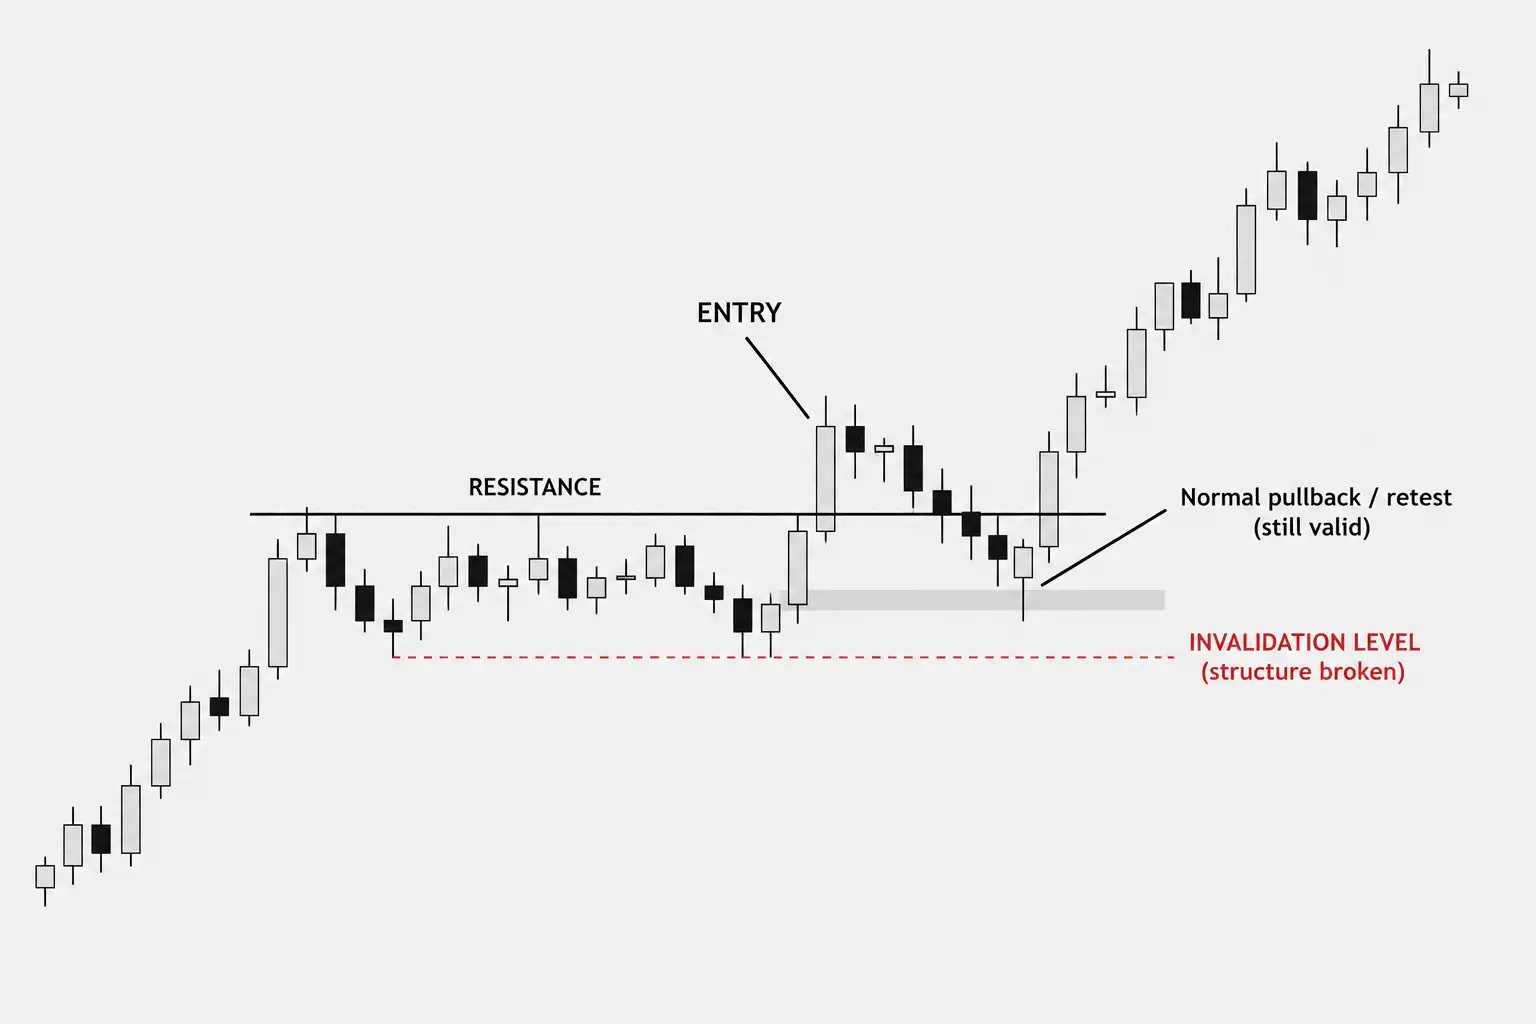
Normal adverse movement occurs while the trade’s underlying premise remains intact. Depending on the setup, that can include a pullback, retest, temporary volatility, or movement within established market structure.
The amount considered normal is setup-specific. A breakout designed to produce immediate follow-through may tolerate relatively little adverse movement. A pullback or mean-reversion setup may routinely require more room before moving in the intended direction.
Historical MAE can help establish what similar trades have typically experienced, but it should be interpreted alongside the setup’s structure, volatility, and entry method. A larger MAE does not by itself prove the entry was early or the stop was too tight.
Structural or Behavioral Invalidation
Adverse movement becomes more important when it conflicts with the assumptions behind the trade.
Structural invalidation occurs when price reaches or breaks a level that the setup requires to hold. Behavioral invalidation is different: structure may remain technically intact, but the trade no longer behaves as expected. A breakout may fail to follow through, momentum may disappear, or price may repeatedly return to an area it was expected to leave.
MAE can provide historical context for these situations, but it does not determine invalidation on its own. The trade’s predefined structural and behavioral rules come first. Excursion data can then help determine whether the movement being observed is typical of trades that recover or more characteristic of trades that fail.
How Should You Measure and Normalize MAE and MFE?
How you normalize MAE and MFE determines whether the resulting numbers mean anything at all.
MAE and MFE can be recorded in points, dollars, percentages, R-multiples, or volatility-adjusted units. The useful measurement depends on what you are trying to compare.
Raw price movement works when trades are directly comparable, but it becomes less useful across instruments or changing volatility. A $2 adverse move may be insignificant in one market and substantial in another.
R-multiples provide one way to standardize excursion relative to the risk defined at entry. If the distance from entry to the initial stop is 1R, an MAE of 0.4R means price traveled 40% of that original risk distance against the position. An MFE of 2R means favorable movement reached twice the original risk distance.
This makes trades easier to compare on a risk-relative basis, but it does not make different strategies equivalent. A 0.4R MAE in a breakout and a 0.4R MAE in a mean-reversion trade can represent very different behavior because the setups and stop logic are different.
Volatility-based measures such as ATR answer a different question. Instead of measuring excursion relative to planned risk, they measure it relative to the market’s recent range. That can help determine whether a move was large or small compared with prevailing volatility.
Neither approach is inherently superior. R provides risk-relative context; ATR provides volatility-relative context. The important requirement is consistency within the analysis being performed.
Data resolution matters as well. A daily bar can show the day’s high and low, but it may not reveal the exact sequence of those prices. For short-duration trades, intraday data may be necessary to measure excursion accurately.
Whatever measurement you choose, define it consistently before comparing trades. Changing the measurement method from one trade to another makes the resulting MAE/MFE data difficult to interpret.
| Measurement | What It Measures Against | Most Useful For |
|---|---|---|
| Price / Points | Absolute movement from entry | Comparing trades in the same instrument under similar conditions |
| Percentage | Movement relative to entry price | Comparing proportional movement across different price levels |
| R-Multiple | Movement relative to initial defined risk | Comparing excursion on a risk-relative basis |
| ATR | Movement relative to recent market range | Comparing excursion relative to prevailing volatility |
Each method provides a different frame of reference. Consistent measurement matters more than choosing one universal “best” method.
Which Trades Belong in the Same MAE/MFE Comparison?
Normalization makes excursion easier to compare, but it does not make unrelated trades equivalent.
A breakout with an MAE of 0.4R and a mean-reversion trade with the same 0.4R MAE have each used 40% of their defined initial risk. That does not mean the excursion has the same significance in both setups.
MAE and MFE are most useful when the trades being compared share similar characteristics. Depending on the strategy, that may include:
- setup type
- entry method
- timeframe
- instrument or market
- volatility environment
- market regime
- long or short direction, if the strategy behaves differently by side
Combining trades with different structural logic can hide the excursion patterns that matter within each setup. A breakout designed for immediate follow-through may produce a very different MAE distribution from a reversal strategy that routinely allows more movement before working.
The objective is not to create the largest possible dataset. It is to create a comparison group that is similar enough for the excursion data to answer a useful question.
Start with the setup itself, then separate the data further only when there is a clear reason to believe another variable materially changes its behavior.
What Can MAE Reveal About Your Entry and Stop?
Once comparable trades are grouped correctly, MAE can help investigate two separate parts of the trade: where you entered and whether the stop gives the setup enough room to behave normally.
The important distinction is that MAE identifies patterns. It does not explain their cause by itself. A recurring adverse excursion can result from entry timing, stop construction, volatility, setup characteristics, or changing market conditions.
Is Your Entry Consistently Too Early?
If successful trades repeatedly experience substantial adverse movement soon after entry, entry timing deserves your attention.
One possible explanation is that the entry trigger occurs before the setup has fully developed. Another is that the strategy naturally enters before a retest or pullback that is part of normal trade behavior. Higher volatility can produce the same pattern without anything being wrong with the entry.
The useful question is not simply whether winner MAE is high. It is whether a different entry rule would reduce adverse excursion without sacrificing trades that contribute to the strategy’s expectancy.
That requires testing. Historical MAE can identify the pattern, but it cannot tell you whether delaying the entry will improve the strategy.
Does Your Stop Match Normal Trade Behavior?
MAE can also show how much of the available stop distance successful trades typically use before moving favorably.
If many winners repeatedly approach the stop before recovering, a tighter stop could remove trades that the existing strategy currently allows to develop. That does not prove the stop should be widened; it may already be positioned correctly relative to the setup’s structural invalidation.
At the other extreme, if successful trades rarely experience much adverse excursion while the stop sits considerably farther away, the difference is worth looking at. It still does not prove that the stop is too wide. The structural reason for the stop remains primary.
The more useful comparison is between the stop’s purpose and the excursion behavior of comparable trades. MAE can reveal whether those two are consistently aligned or whether there is a discrepancy worth testing.
Stop changes should begin with a hypothesis, not an historical extreme. The deepest MAE survived by a past winner is not automatically the correct stop distance for future trades. Entry quality and stop distance work together, not separately.
What Can MFE Reveal About Your Target and Exit?
Maximum Favorable Excursion shows how far a trade moved in your favor while it remained open. Compared across similar trades, it can help evaluate whether profit targets and exit rules are consistent with the favorable movement the setup actually produces.
MFE does not tell you what the target or exit should be. It shows what was available historically. Whether more of that movement could have been captured without damaging expectancy is a separate question that must be tested.
Is Your Profit Target Realistic?
Compare the planned target with the MFE distribution of comparable trades.
If many trades rarely reach the target before reversing, the target may deserve review. It could be asking for more favorable movement than the setup typically produces.
The opposite pattern can also be informative. If successful trades routinely move well beyond a fixed target, a larger target may appear attractive. But that does not prove that extending the target would improve results. Holding for more favorable movement may reduce the percentage of trades that reach the target, increase profit giveback, or change the distribution of returns.
MFE therefore helps test whether a target is consistent with historical trade behavior. Market structure and the logic of the setup still determine whether the target itself makes sense.
How Much of the Favorable Move Are You Actually Capturing?
Comparing MFE with realized profit shows how much of the trade’s maximum favorable movement was ultimately retained.
Suppose a trade reaches an MFE of +2R but closes at +0.8R. The difference is information, not proof of poor management.
Some strategies intentionally allow substantial profit giveback because their exit rules are designed to remain in occasional large trends. Others may consistently surrender favorable movement without receiving enough additional return in exchange.
| Trade | MFE | Final Result | What It Shows |
|---|---|---|---|
| A | +2.0R | +1.6R | Most of the favorable excursion was retained. |
| B | +2.0R | +0.8R | Substantial favorable movement was given back. Worth reviewing, but not automatically poor management. |
| C | +0.9R | -1.0R | The trade produced meaningful favorable movement before ultimately failing. |
| D | +4.0R | +1.5R | Large giveback may still be consistent with an exit designed to stay exposed to larger moves. |
MFE shows the maximum favorable movement available while the trade was open. The gap between MFE and the final result is information to investigate—not proof that the exit was wrong.
The useful analysis is not simply:
“How much MFE did I leave behind?”
It is:
“Does the current exit method convert favorable excursion into realized returns in a way that supports the strategy’s overall expectancy?”
Losing trades can also be informative. If many eventual losers first produce substantial MFE, that may justify testing whether target placement, partial exits, breakeven rules, or another management decision deserves review. It does not establish which change, if any, will improve performance.
MFE measures favorable distance, not the path or timing of that movement. If you want to know whether trades tend to reach their maximum favorable excursion quickly or gradually, you need additional data such as time-to-MFE or the sequence of price movement while the trade is open.
How Do You Know Whether an MAE/MFE Pattern Is Actually Meaningful?
Finding a difference in MAE or MFE is easy. Determining whether that difference contains useful information is harder.
An excursion pattern becomes interesting when it appears repeatedly among comparable trades, differs meaningfully across outcomes, and is not being created by a few unusual observations. Even then, it should be treated as evidence for further testing rather than as a trading rule.
Compare Winners and Losers
Analyzing winners alone creates an incomplete picture.
Suppose successful trades usually remain below 0.4R of MAE. That number seems useful until you discover that losing trades also spend most of their time below 0.4R before eventually failing. In that case, MAE may provide little useful distinction between the two groups.
The comparison that matters is whether winner and loser excursion behavior differs enough to raise a practical question.
For example:
- Do losers consistently experience deeper MAE than winners?
- Do many losers reach meaningful MFE before reversing?
- Do winners recover from adverse movement that losers rarely survive?
- Do the two groups overlap so heavily that excursion provides little useful separation?
Sometimes the correct conclusion is that MAE or MFE does not distinguish outcomes well for that setup. That is still useful information.
Look at the Distribution, Not Just the Average
Averages can hide the structure of the data.
An average winner MAE of 0.5R could represent trades tightly clustered around 0.5R. It could also result from many trades near 0.2R and a few extreme observations near 1R. Those are very different distributions.
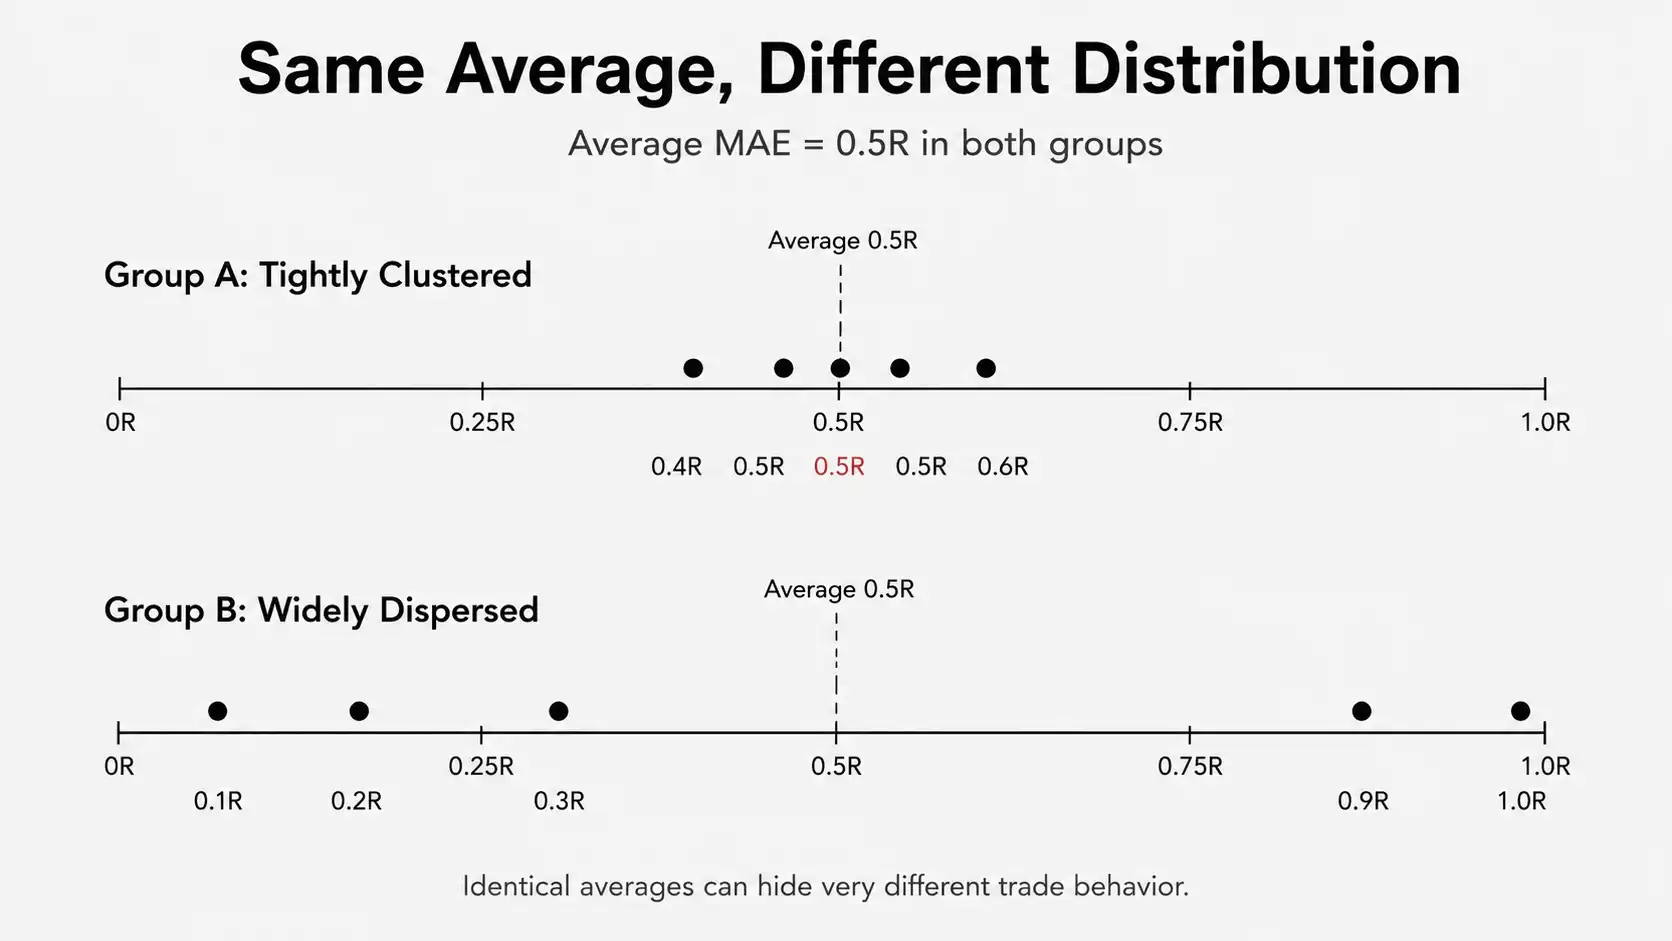
Review the median, range, percentiles, clustering, and outliers where the sample allows it. The objective is to understand where most trades actually fall and how much overlap exists between winners and losers.
Outliers deserve caution. A single historical winner that survived unusually deep adverse movement should not determine where future stops are placed.
Check Whether the Pattern Holds Up
A pattern observed in a small or narrow sample may disappear when more trades are added.
There is no universal number of trades that guarantees reliability. The required sample depends on the strategy, frequency of trades, and variability of outcomes. What matters is whether the relationship appears repeatedly rather than being concentrated in a handful of examples.
Also check whether the pattern remains reasonably consistent across different periods and comparable market conditions. If an MAE relationship appears only during one volatility regime or one short stretch of data, it should carry less weight than a pattern that persists across broader samples.
The standard is not perfection. Market behavior changes, and historical excursion distributions will not remain identical. The question is whether the relationship is stable enough to justify forming a specific hypothesis and testing it separately.
When Should MAE and MFE Actually Change a Trading Rule?
A stable MAE or MFE pattern is not a reason to change a trading rule. It is a reason to test whether a change could improve the strategy.
Excursion data describes what happened under the existing rules. Turning that observation into a new stop, entry, target, or management rule introduces a different strategy. The new version must therefore be evaluated on its own results.
Turn the Observation Into a Testable Hypothesis
Start with a specific observation.
For example:
“Most winning trades experience less than 0.4R of MAE.”
That is descriptive but it does not tell you what to do.
A testable hypothesis would be:
“Reducing the stop distance may lower average loss without removing enough winning trades to reduce expectancy.”
That statement can be tested.
The same process applies to MFE. If winners routinely reach considerably more favorable excursion than the amount eventually realized, the observation may justify testing a different exit rule. It does not prove that holding longer will improve results.
Keep the proposed change to one variable at a time. Adjusting the entry, stop, target, and management rule at the same time makes it difficult to determine which change produced the new outcome.
Validate the Change Before Using It
Evaluate the proposed rule across the full distribution of trades, not just the examples that originally suggested the change.
- Tighter stop: may reduce average loss, but can also remove trades that previously survived normal adverse movement.
- Larger target: may increase some winner sizes, but can reduce how often the target is reached.
- Earlier exit: may reduce drawdown, but can also eliminate trades that later recover.
Those trade-offs matter more than whether MAE or MFE looks better after the change.
Where possible, test the hypothesis on trades or periods that were not used to identify the original pattern. Then compare the revised strategy with the original using measures that reflect the entire outcome distribution, including expectancy, win rate, average win, average loss, and drawdown.
The objective is not to minimize MAE or maximize MFE. It is to determine whether the proposed change improves the strategy without creating a larger weakness elsewhere.
A useful sequence is:
Measure → Segment → Compare → Form a Hypothesis → Test → Validate → Change
MAE and MFE can reveal where a trading rule deserves scrutiny. They should not become trading rules simply because a historical pattern looks convincing.
What MAE and MFE Can—and Cannot—Tell You
There is no universal amount of adverse movement that separates a healthy trade from a bad one. What matters is how comparable trades from the same setup have behaved, whether the original trade premise remains valid, and whether the excursion patterns are consistent enough to deserve further investigation.
MAE shows how far price moved against the entry. MFE shows how far it moved in favor. Together, they can expose questions about entry timing, stop placement, target realism, and exit behavior that final profit or loss alone cannot reveal.
The value comes from studying distributions rather than isolated trades. Measure excursion consistently, compare similar setups, examine winners and losers, and determine whether the apparent differences persist across enough observations to be meaningful.
Then stop short of turning the pattern directly into a trading rule.
MAE and MFE are diagnostic tools. They can show where a strategy deserves scrutiny, but any proposed change still has to prove that it improves the strategy as a whole.
Measure the behavior. Identify the pattern. Test the hypothesis. Change the rule only if the evidence supports it.
